Section 2.10
Problem 37. The consumption of a finite resource is often modeled using the logistic equation. Let y(t) be the cumulative amount of a resource consumed and y∞ be the total amount that was initially available at t = −∞. Model the rate of consumption [I wish Russ and I had written “amount consumed” instead of “rate of consumption”] using Eq. 2.29 over the range −∞ < t < ∞.
(a) Set y0 = y∞/2, so that the zero of the time axis corresponds to when half the resource has been used. Show that this simplifies Eq. 2.29.
(b) Differentiate y(t) to find an expression for the rate of consumption. Sketch plots of dy/dt versus t on linear and semilog graph paper. When does the peak rate of consumption occur?
When this model is applied to world oil consumption, the maximum is called Hubbert’s peak (Deffeyes 2008).The answer to this exercise can be found in the IPMB solution manual. (The solution manual is available free of charge to instructors. If you need a copy, email me at roth@oakland.edu.) All exercises in the solution manual have a brief preamble, explaining the goal of the exercise and why it’s important.
2.37¶ This is not a biological example, except in the sense that if we ignore this example we humans may all end up dead. Students use a variation of the logistic equation to analyze the consumption of a finite resource (e.g., oil).
I won’t solve the entire problem in this blog post, but I will show the semilog plot from the solution manual.
 | ||||
| A semilog plot of amount consumed (solid) and the rate of consumption (dashed) for a finite resource modeled using the logistic equation. This plot is part of the solution to Problem 37b. | |
 |
| Energy: A Human History, by Richard Rhodes. |
The rate of consumption of the resource (dy/dt) first rises exponentially, reaches a peak, and then falls exponentially. (Remember, a straight line on a semilog plot corresponds to exponential growth or decay.) For the mathematically inclined, the dy/dt curve corresponds to a hyperbolic secant squared.
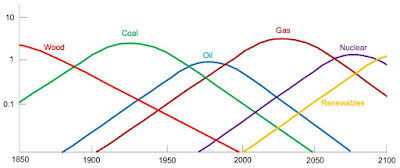
Why do I bring up this topic? Recently I read Energy: A Human History, by Richard Rhodes, a sweeping account of energy transitions that changed our world. Rhodes includes a figure that looks a little bit like this:
 |
| My rendition of a figure from the final chapter of Energy: A Human History showing the historical evolution of the world energy mix. |
I should add a few qualifiers.
- Historical data is noisy and the curves pictured above merely approximate a complicated behavior.
- The plot begins at about the time of the industrial revolution. The population of humans was probably too small, and our technology too primitive, to apply this model before that time.
- All future data (say, after 2016, the year Energy was published) is extrapolation or prediction.
- I labeled the yellow curve on the right “Renewables” but it really represents whatever comes next, be it wind, solar, hydroelectric, geothermal, or even nuclear fusion.
- Let’s hope that the Renewables curve corresponds to an infinite resource, not a finite one, so it will never reach a peak and then fall. Is that wishful thinking? I don’t know, but the figure encourages us to ask such questions.
- Nuclear energy shot up much faster than would be expected right after World War II, but then the curve flattened prematurely because of fears about radiation.
- Natural gas appears to be with us for the foreseeable future, unless we can wean ourselves off of it to address global warming. The use of coal is almost done (regardless of what a certain senator from West Virginia thinks), and the use of oil has reached its peak and is on its way down (now might be a good time to buy an electric car).
- Climate change is the critical issue looming over the right side of the plot. We must leave many of those fossil fuels (coal, oil, gas) in the ground to prevent an environmental disaster.
Perhaps I need to add extra parts to that homework problem.
(c) Suppose at time t you discover that pollution from this finite resource is killing people, and you stop consuming it immediately. How would that change the plots you made in part (b)?
(d) What would happen if the resource is killing people but people continue to consume it nevertheless?
Richard Rhodes, The Light of New Fires: Energy Transitions Yesterday and Today, presented at the American Museum of Science and Energy, Oak Ridge, Tennessee, October 22, 2015.


No comments:
Post a Comment