Friday, December 30, 2022

The Development of Transcranial Magnetic Stimulation

When I worked at the National Institutes of Health, I studied transcranial magnetic stimulation. In Chapter 8 of Intermediate Physics for Medicine and Biology, Russ Hobbie and I describe this technique to activate neurons in the brain.
Since a changing magnetic field generates an induced electric field, it is possible to stimulate nerve or muscle cells without using electrodes. The advantage is that for a given induced current deep within the brain, the currents in the scalp that are induced by the magnetic field are far less than the currents that would be required for electrical stimulation. Therefore transcranial magnetic stimulation (TMS) is relatively painless.

The method was invented in 1985 and when I arrived at NIH in 1988 the field was new and ripe for analysis. I spent the next seven years calculating electric fields in the brain and determining how the electric field couples to a nerve.

Roth, B. J. (2022) The Development of
Transcranial Magnetic Stimulation,
BOHR International Journal of
Neurology and Neuroscience
,
Volume 1, Pages 8–20.
Recently, I wrote a review article telling the story of how transcranial magnetic stimulation began. You can get a copy at https://www.bohrpub.com/journals/BIJNN/BIJNN_20231102; it is an open access article so everyone is free to download it. The abstract states
This review describes the development of transcranial magnetic stimulation in 1985 and the research related to this technique over the following 10 years. It not only focuses on work done at the National Institutes of Health but provides a survey of other related research as well. Key topics are the calculation of the electric field produced during magnetic stimulation, the interaction of this electric field with a long nerve axon, coil design, the time course of the magnetic stimulation pulse, and the safety of magnetic stimulation.

Readers of this blog will recognize some of the topics from earlier posts, such as the calculation of the induced electric field, determining the site of stimulation along a peripheral nerve, Paul Maccabee’s wonderful article, the four-leaf coil, the heating of metal electrodes, implantable microcoils, and Tony Barker's online interview. You could almost say I pre-wrote much of the review using this blog as my test bed. 

I like magnetic stimulation because it's a classic example of how a fundamental concept from physics can have a major impact in biology and medicine. If you combine this review of transcranial magnetic stimulation together with my earlier review of the bidomain model of cardiac tissue, you get a pretty good summary of my most important research.

Enjoy!
Friday, December 23, 2022

Think Before You Calculate!

I encourage students to build their qualitative problem solving skills by recasting equations in dimensionless variables, analyzing the limiting behavior of mathematical expressions, and sketching plots showing how functions behave. “Think Before You Calculate!” is my mantra. But how, specifically, do you do this? Let me show you an example.

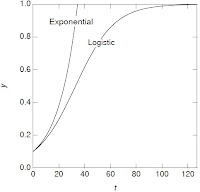
A plot of the solution to the logistic equation.
Fig. 2.16 from IPMB. A plot of the solution
of the logistic equation when y0 = 0.1,
y = 1.0, b0 = 0.0667. Exponential
growth with the same values of
y0 and b0 is also shown.
In Section 2.10 of Intermediate Physics for Medicine and Biology, Russ Hobbie and I discuss the logistic model.
Sometimes a growing population will level off at some constant value. Other times the population will grow and then crash. One model that exhibits leveling off is the logistic model, described by the differential equation

dy/dt = b0 y (1 – y/y) ,                           (2.28)

where b0 and y are constants….

If the initial value of y is y0, the solution of Eq. 2.28 is

y(t) = 1 / [1/y + (1/y0 – 1/y) eb0t] .    (2.29)
Below is a new homework problem, analyzing the logistic equation in a way to build insight. Consider it an early Christmas present. Santa won’t give you the answer, so you need to solve the problem yourself to gain anything from this post.
Section 2.10

Problem 36 ½. Consider the logistic model.

(a) Write Eq. 2.28 in terms of dimensionless variables Y and T, where Y = y/y and T = b0t.

(b) Express the solution Eq. 2.29 in terms of Y, T, and Y0 = y0/y.

(c) Verify that your solution in part (b) obeys the differential equation you derive in part (a).

(d) Verify that your solution in part (b) is equal to Y0 at T = 0.

(e) In a plot of Y(T) versus T, which of the three constants (y, y0, and b0) affect the qualitative shape of the solution, and which just scale the Y and T axes? 

(f) Verify that your solution in part (b) approaches 1 as T goes to infinity.

(g) Find an expression for the slope of the curve Y = Y(T). What is the slope at time T = 0? For what value of Y0 is the initial slope largest? For what values of Y0 is the slope small?

(h) The plot in Fig. 2.16 compares the solution of logistic equation with the exponential Y = Y0 eT. The figure gives the impression that the exponential is a good approximation to the logistic curve at small times. Do the two curves have the same value at T = 0? Do the two curves have the same slope at T = 0?

(i) Sketch plots of Y versus T for Y0 = 0.0001, 0.001, 0.01, and 0.1.

(j) Rewrite the solution from part (b), Y = Y(T), using the constant T0, where T0 = ln[(1−Y0)/Y0]. Show that varying Y0 is equivalent to shifting the solution along the T axis. What value of Y0 corresponds to T0 = 0?

(k) How does the logistic curve behave if Y0 > 1? Sketch a plot of Y versus T for Y0 =1.5.

(l) How does the logistic curve behave if Y0 < 0? Sketch a plot of Y versus T for Y0 = –0.5.

(m) Plot Y versus T for Y0 = 0.1 on semilog graph paper.

If you solve this new homework problem and want to compare you solution to mine, email me at roth@oakland.edu and I’ll send you my solution. 

The Logistic Equation, MIT OpenCourseWare

https://www.youtube.com/watch?v=TCkLSYxx21c&t=69s

Friday, December 16, 2022

Mark Hallett Festschrift

Mark Hallett
Mark Hallett
Last Monday I attended (over the internet) a Festschrift to honor the retirement of Mark Hallett from the intramural program at the National Institutes of Health. Russ Hobbie and I cite Hallett in Chapter 8 of Intermediate Physics for Medicine and Biology.
Magnetic stimulation can be used to diagnose central nervous system diseases that slow the conduction velocity in motor nerves without changing the conduction velocity in sensory nerves (Hallett and Cohen 1989).
The reference is to a wonderful paper that Hallett and Leo Cohen wrote in the Journal of the American Medical Association.
Hallett M, Cohen LG (1989) Magnetism: A new method for stimulation of nerve and brain. JAMA 262:538–541.
Hallett came to NIH in 1984 and worked there for almost 40 years. I collaborated with him in the early 1990s, when I was working in NIH’s Biomedical Engineering and Instrumentation Program. My role was to calculate the electric field induced in the brain during transcranial magnetic simulation.

For a long time, Hallett was the clinical director for the National Institute of Neurological Disorders and Stroke intramural program. According to Google Scholar, his papers are cited about ten times every day, and his h-index is over 100, meaning he has published over 100 papers that have each been cited over 100 times. He has had an enormous impact on the field of neurophysiology. In particular, he trained an amazing number of young scholars who have gone on to be leaders in the field themselves, many of who spoke at the event.

Mark Hallett
Mark Hallett
Below is Hallett’s biography found on his NIH webpage.
Dr. Hallett obtained his A.B. and M.D. at Harvard University, had his internship in Medicine at the Peter Bent Brigham Hospital and his Neurology training at Massachusetts General Hospital. He had fellowships in neurophysiology at the NIH and in the Department of Neurology, Institute of Psychiatry in London, where he worked with C. David Marsden. Before coming to NIH in 1984, Dr. Hallett was the Chief of the Clinical Neurophysiology Laboratory at the Brigham and Women's Hospital in Boston and progressed to Associate Professor of Neurology at Harvard Medical School. He is currently Chief of the Medical Neurology Branch and Chief of its Human Motor Control Section. He is now Past-President of the International Federation of Clinical Neurophysiology. He has been President of the International Parkinson and Movement Disorder Society and Vice-President of the American Academy of Neurology. He served as Editor in Chief of Clinical Neurophysiology. Among many awards, in 2012 he became an Honorary Member of the American Neurological Association, and in 2014 won the Lifetime Achievement Award of the American Association of Neuromuscular and Electrodiagnostic Medicine. In 2017 he received the degree of Doctor of Medicine Honoris Causa from the University of Hamburg, and in 2018 was made an Honorary Member of the European Academy of Neurology. His research activities focus on the physiology of human voluntary movement and its pathophysiology in disordered voluntary movement and involuntary movement.

Once Hallett told me that he started out college studying physics, but when his instructor explained to his class that a magnetic field is just a relativistic effect of an electric field (see Problem 5 in Chapter 8 of IPMB) he switched to a premed program! 

At the end of his Festschrift, Hallett spoke and honored his many mentors. His final words were "I will be retiring, but not too much."

Enjoy your retirement, Mark Hallett, but not too much. Working with you was a delight.

https://www.youtube.com/watch?v=eR-D9bLWKhQ 

Oral History 2013: Stanley Fahn Interviews Mark Hallett

Friday, December 9, 2022

Surface Tension

Air and Water, by Mark Denny, superimposed on Intermediate Physics for Medicine and Biology.
Air and Water,
by Mark Denny.
In Intermediate Physics for Medicine and Biology, Russ Hobbie and I don’t talk much about surface tension. However, in Air and Water, Mark Denny devotes several chapters to it. He begins
We are now at the first of three chapters in which we explore the physics of the interface between water and air. As we will soon discover, the interface is a bizarre and fascinating place. To begin with, it is truly two-dimensional: it has neither outside nor inside. It is not contained in the water nor is it contained in the air; it is simply the place at which they meet. As such, its properties are not those of air or water alone, but of their mutual interaction, and these can be both surprising and nonintuitive…

We begin this exploration with an examination of the phenomenon known as surface tension. This is the force that keeps water droplets spherical, and it has a variety of biological consequences. For instance, we will see how surface tension allows trees to grow to majestic heights and flies to adhere to glass; how surface tension allows some insects to breathe under water and others to walk upon it.
Surface tension arises because a water molecule is usually hydrogen bonded to several other water molecules surrounding it. On the water surface, however, there is at least one hydrogen bond missing, so a higher surface energy is required to produce additional surface area. The surface energy of water in air is denoted γ and has a value of 0.07 J/m2. This is a fairly high surface energy compared to most other liquids (for instance, everyone’s favorite, ethanol, has a surface energy of only 0.02 J/m2).

After explaining the origin of surface energy, Denny adds an important caveat.
In nature it is extremely rare to find an air-water interface that is not fouled to some extent with an ill-defined organic film. Most biological molecules (fatty acids in particular) can lower the surface energy to a fraction of that found in pure water. As a result, the surface of all but the cleanest bodies of water is likely to have a lower surface energy than reported here.
Denny then relates the concept of surface energy to that of surface tension.
To this point we have discussed the air-water interface in terms of its surface energy. Why, then, is this chapter entitled “Surface Tension”? It turns out that surface tension is just another way of expressing surface energy.

In the abstract, this is easily seen by comparing the units of the two expressions. Surface energy is expressed as J m−2. But a joule is one newton meter, so J m−2 is the same as N m−1, that is, force per distance, a tension.
Surface tension is related to the concept of capillarity. Water tends to adhere to a clean glass surface. Therefore, water will rise in a hollow glass tube until it reaches a height at which the weight of the column is balanced by the adhesion force. This height is proportional to the surface tension and is inversely proportional to the radius of the tube. Denny observes that
Because the water in the tube is, in essence, hanging from the air-water interface, it is at a lower pressure than that of the surrounding air. As a result, if one were to poke a hole in the side of the tube, air would be drawn in rather than water being forced out.
Denny shows how capillarity is used to get water up a tree. Even more interesting is his discussion of insect tracheae.
Consider, for instance, the problems faced by insects. These animals rely on their tracheae and tracheoles to deliver oxygen to their muscles and to remove carbon dioxide… This system works only because the tracheae are tracheoles are filled with air. If these small tubes become filled with water, the rate at which they transport O2 and CO2 decreases 10,000-fold [because of the 100-fold difference of the diffusion constant in air and water]. How does the respiratory system of insects keep from filling up with water via capillarity?

The answer is likely to be that the inner surface of the respiratory system is coated with some substance that is not wetted by water… If the tracheae and tracheoles are coated with a waxy substance similar to that found on the external cuticle of many insects, water has no tendency to fill the system, and effective respiration is possible.

Denny then analyzes the law of Laplace, relating the air pressure inside a bubble to its radius and water’s surface tension. Russ and I analyze the case of a spherical bubble in Homework Problem 60 of Chapter 3 in IPMB

Denny concludes the chapter by examining animals that can walk on water.

The surface of lakes and streams provides a unique opportunity for terrestrial organisms. An animal that can walk on water has available to it a flat substratum from which to hunt aquatic prey and a refuge on which to escape from predators. There is just one problem: How does an animal manage to walk on water?

Surface tension, of course, provides the answer. If the animal contacts the water with a nonwettable structure of sufficient perimeter, the upward force of surface tension can support the organism’s weight. 

This only works for small animals.

The prospect of walking on water becomes less likely the larger the animal becomes. The crux of the problem is that an animal’s weight increases as the cube of a linear measure of its size, whereas the force due to surface tension increases in direct proportion to a linear measure (in this case, perimeter). For example, a mouse with a mass of 100 g weights 1 N. If the animal had feet coated with the same wax available to a water strider, it would need a perimeter of 40.3 m in contact with the water, roughly 10 m per foot. Feet of this size would clearly be impractical, and for this reason animals the size of mice do not walk on water.

Friday, December 2, 2022

The Neper

When discussing the attenuation of sound in Intermediate Physics for Medicine and Biology, Russ Hobbie and I write
In acoustics, the attenuation is usually expressed in decibels per meter.
At the bottom of the page is this footnote:
Sometimes the attenuation coefficient is expressed in nepers m−1, in which case the natural logarithm of the intensity or pressure ratio is used.

The neper? What’s that?

First, let’s review the decibel. If the pressure amplitude of two sound waves are p1 and p2, their relative pressure can be written as

            20 log10(p2/p1).

When expressed in this way, the pressure difference is said to be in decibels (dB). If p2 is ten times p1, then the pressure difference is 20 log10(10) or 20 dB.

Often we express sound in terms of intensity rather than pressure. The intensity is proportional to the pressure squared, so the relative intensity difference of I1 and I2 is

            10 log10(I2/I1).

The leading factor of 20 in the expression containing the pressures is replaced by 10 in the expression containing intensities. If you don’t like that factor of ten out front, you could not use it, in which case your intensity difference is expressed in the rarely used unit of bels rather than decibels.

Notice that the decibel is defined using of a logarithm with base ten, also known as the common logarithm. Alternatively, we could use the natural logarithm, with base e = 2.718..., which leads to the neper. However—and this is the confusing part—instead of having the leading factor of 20 in the expression for decibels in terms of pressure, the expression for nepers has no leading factor at all. A factor of 2 is removed because the neper is defined in terms of the pressure and not intensity, and a factor of 10 is removed because nepers are like bels and not decibels. So,

            ln(p2/p1)

is the pressure difference in nepers. If you insist on using intensity rather than pressure, you must use the ugly-looking expression

            ½ ln(I2/I1) .

A ten-fold difference in intensity is 1.15 nepers (Np), so 10 dB is the same as 1.15 Np, or 1 Np = 8.7 dB. If a sound wave attenuates at a rate of 1 neper per meter that means for every meter traveled the pressure falls by a factor of e and the intensity falls by a factor of 7.4. In tissue, attenuation is usually proportional to frequency, so as a rule of thumb the attenuation is about 100 dB per meter per megahertz or roughly 12 neper per meter per megahertz.

Asimov's Biographical Encyclopedia of Science & Technology.
Asimov's Biographical Encyclopedia
of Science & Technology
,
by Isaac Asimov.
Where does the strange name “neper” come from? It honors the inventor logarithms, John Napier. Here is a excerpt about Napier from Asimov's Biographical Encyclopedia of Science & Technology.

NAPIER, John (nay’pee-ur) 
Scottish mathematician
Born: Merchiston Castle, near Edinburgh, 1550 
Died: Merchiston Castle, near Edinburgh, April 4, 1617

... Napier’s solid reputation rests upon a new method of calculation that first occurred to him in 1594… It occurred to Napier that all numbers could be expressed in exponential form. That is, 4 can be written as 22, while 8 can be written as 23, and 5, 6, and 7 can be written as 2 to some fractional power between 2 and 3. Once numbers were written in such exponential form, multiplication could be carried out by adding exponents, and division by subtracting exponents. Multiplication and division would at once become no more complicated than addition and subtraction.

Napier spent twenty years working out rather complicated formulas for obtaining exponential expressions for various numbers. He was particularly interested in the exponential forms of the trigonometric functions, for these were used in astronomical calculations and it was these which Napier wanted to simplify. His process of computing the exponential expressions led him to call them logarithms (“proportionate numbers”) and that is the word still used.

Finally, in 1614, Napier published his tables of logarithms, which were not improved on for a century, and they were seized on with avidity. Their impact on the science of the day was something like that of computers on the science of our own time. Logarithms then, like the computers now, simplified routine calculations to an amazing extent and relieved working scientists of a large part of the noncreative mental drudgery to which they were subjected.

Friday, November 25, 2022

Reduced Mass

In Section 14.4 of Intermediate Physics for Medicine and Biology, Russ Hobbie and I discuss molecular energy levels. In particular, we examine translational, rotational, and vibrational levels. When analyzing rotational levels, we consider a simple diatomic molecule and divide the motion into two parts: a uniform translation of the center of mass, and a rotation about the center of mass. We show that the rotational energy can be written as ½2, where ω is the rotational angular frequency and I is the moment of inertia. The moment of inertia is I = [m1 m2/(m1 + m2)] R2, where m1 and m2 are the mass of the two atoms making up the diatomic molecule, and R is the distance between them. In quantum mechanics, the spacing of rotational energy levels depends on I.

Later in the same section, Russ and I consider vibrational motion. However, we don’t do a detailed analysis for a diatomic molecule, like we did for rotational motion. In this blog post, I will remedy that situation and present the analysis of vibrations of a diatomic molecule. Our goal is to derive an expression for the vibration frequency in terms of the masses of the two atoms and the spring constant connecting them.

Let’s do the analysis in one dimension. Consider two atoms with mass m1 and m2 connected by a spring with spring constant k. The position of m1 is x1, and the position of m2 is x2.

First, write down Newton’s second law for each atom.

    m1 d2x1/dt2  = − k (x1x2 ) ,

    m2 d2x2/dt2  =    k (x1 x2 ) .

Next, define two new variables, as we did for rotational motion: x, the position of the center of mass, and X, the distance between the two masses

     x = [m1/(m1+m2)] x1 + [m2/(m1+m2)] x2 ,

    X = x1x2 .

Then, rewrite Newton’s second law in terms of x and X. After some algebra, we get two equations

     (m1+m2) d2x/dt=  0 

     [m1m2/(m1+m2)] d2X/dt=   − kX

The first equation represents a free particle of mass M, where

     M = m1+m2 ,

and the second equation represents a bound particle with spring constant k and mass m (often called the reduced mass)

     m = m1m2/(m1+m2) . 

The angular frequency of the vibration is therefore

     ω = √(k/m)

(If you don’t follow that last step, see Appendix F of IPMB).

We have reached our goal: the angular frequency of the vibration, ω, written in terms of k, m1, and m2

     ω = √[k (m1+m2)/m1m2]

In quantum mechanics, the energy levels depend on ω, and therefore on the reduced mass m.

If m1 >> m2 then m is approximately m2. Likewise, if m2 >> m1 then m is approximately m1. For example, if you want the vibration frequency of hydrogen chloride (HCl), the reduced mass is close to the mass of the hydrogen atom.

If m1 = m2 = μ (like for molecules such as O2 and N2), then the reduced mass m is equal to μ/2. It’s that factor of two in the denominator that’s the surprise.

Quantum Physics of Atoms, Molecules, Solids, Nuclei and Particles, by Eisberg and Resnick, superimposed on Intermediate Physics for Medicine and Biology.
Quantum Physics of Atoms,
Molecules, Solids, Nuclei and Particles
,
by Eisberg and Resnick.

The relationship between m, m1, and m2 can be written

    1/m = 1/m1 + 1/m2 .

This looks just like the equation for adding resisters in parallel

If you want to learn more, I suggest looking at Chapter 12 of Quantum Physics of Atoms, Molecules, Solids, Nuclei, and Particles, by Robert Eisberg and Robert Resnick, often cited in IPMB.

Friday, November 18, 2022

Randy Travis

Forever and Ever, Amen,
by Randy Travis.
I’m a big fan of country music. After all, I was a graduate student in Music City: Nashville. I used to ride my bike down to 16th Avenue by the original Country Music Hall of Fame and listen to the up-and-coming singers perform on the street. During the late 1980s, just as I was finishing my dissertation, the biggest country star was Randy Travis. His debut album, Storms of Life, appeared in 1986, and for the next several years he dominated the country music scene.

I recently listened to Travis’s 2019 autobiography, Forever and Ever, Amen. It tells the story of his glory years, but also covers his troubled youth, his time as the singing cook at the Nashville Palace nightclub, and his tragic health problems.

In 2013 Travis was incapacitated by a massive stroke. The most common type of stroke occurs when a clot blocks the flow of blood to part of the brain. Stroke is ranked as the fifth leading cause of death in the United States; every four minutes someone dies of a stroke. Many of those that survive have brain damage. Following his stroke, Travis suffered from limited use of his right hand and severe speech impairment.

The question for readers of Intermediate Physics for Medicine and Biology is, how can physics address stroke? Two applications that are important for stroke diagnosis and treatment are Diffusion Tensor Imaging and Transcranial Magnetic Stimulation. In diffusion tensor imaging, diffusion in the brain is measured using strong gradient magnetic fields applied during magnetic resonance imaging. Diffusion is anisotropic in the brain’s white matter, with water diffusing faster parallel to nerve axon tracts than perpendicular to them. In IPMB, Russ Hobbie and I write
Diffusion is usually greater along the direction of the nerve or muscle fibers. Since the orientation of the fibers changes throughout the body, the elements of the diffusion tensor vary as well. However, some features of the diffusion tensor, such as the trace (see Prob. 49), are independent of the fiber direction, and are particularly useful when monitoring diffusion in anisotropic tissue, such as the white matter of the brain. In addition, the diffusion tensor contains information about the fiber direction, allowing one to map fiber tract trajectories noninvasively using MRI (Basser et al. 2000).
Diffusion can serve as a biomarker to diagnose stroke and to monitor recovery.

Transcranial magnetic stimulation (TMS) is a method to excite neurons in the brain. Russ and I describe it as
Magnetic stimulation can be used to diagnose central nervous system diseases that slow the conduction velocity in motor nerves without changing the conduction velocity in sensory nerves (Hallett and Cohen 1989). It could be used to monitor motor nerves during spinal cord surgery, and to map motor brain function. Because TMS is noninvasive and nearly painless, it can be used to study learning and plasticity (changes in brain organization over time; Wassermannet al. 2008). Recently, researchers have suggested that repetitive TMS might be useful for treating disorders such as depression (O’Reardon et al. 2007) and Alzheimer’s disease (Freitas et al. 2011).

You could add stroke to the list of disorders that might benefit from repetitive transcranial magnetic stimulation. I say “might” because the technique is still being studied as a stroke therapy, but any method that influences brain plasticity has at least the potential to be useful to stroke victims.

Now, almost ten years after his stroke, Travis continues to slowly recover. Although he has not yet been able to return to a singing career, in 2016 he did lead his fans in singing Amazing Grace when he was inducted into the Country Music Hall of Fame. His autobiography is captivating and inspiring. The courage and tenacity of stroke victims should motivate us all to use our science to address this devastating illness.

Randy Travis sings Amazing Grace at his induction into the Country Music Hall of Fame.

https://www.youtube.com/watch?v=11bgiJH1zhA


Randy Travis singing his signature song, Forever and Ever, Amen.

https://www.youtube.com/watch?v=KtKXc_v2iLE


Randy Travis singing Storms of Life.

https://www.youtube.com/watch?v=piTt6zu2FKs

Friday, November 11, 2022

The Intellectual Immigration That Has Mattered Most to Biology

The Eighth Day of Creation,
by Horace Freeland Judson.
In Intermediate Physics for Medicine and Biology, Russ Hobbie and I analyze the role physics plays in the biological sciences. What is that role, and how did it begin? Insight can be found in Horace Freeland Judson’s classic book The Eighth Day of Creation: The Makers of the Revolution in Biology. The development of molecular biology occurred in the mid-twentieth century and was spurred in part by immigrant physicists escaping central Europe before the start of World War II. Judson describes this intellectual exodus from physics to biology.

The mass intellectual emigration from continental Europe in the 1930s, which so stimulated physical science in the United States and England, also had profound consequences for biology, even though the men involved were fewer and younger, with their reputations still to make. They included [Max] Perutz, who left Austria for England in 1936, and [Erwin] Chargaff, also an Austrian, who emigrated to the United States in 1934. A less direct influence was the distinguished and passionately intelligent Hungarian physicist Leo Szilard, who in the 1930s had been the first to envision the possibility that sustained nuclear fission, a chain reaction, would work and cause an explosion, and the first to urge that the United States should try to make an atomic bomb. Szilard wrote the letter about the idea that [Albert] Einstein signed and that was read to [President Franklin] Roosevelt in 1939. Szilard worked on the atomic project at the University of Chicago through the war; afterwards, in reaction against the weapons and against the big-money, big-team physics he had been instrumental in creating, he turned to biology and also to campaigning within the international scientific community for disarmament—for example, through the Pugwash conferences, which he helped to found. In 1947, [University of Chicago chancellor Robert] Hutchins gave Szilard the physicist an appointment as professor of biology and sociology. In the early years of molecular biology, Szilard was an erratic if interesting experimenter and theorist, a cross-pollinator of ideas and an effective critic of others’ work, an intellectual and ethical inspiration to younger scientists. 

The most important immigrant to biology, however, was Max Delbrück. Delbrück was German, born to the aristocracy of the intellect—his father was the professor of history and his uncle the professor of theology in the University of Berlin—and trained as a quantum physicist. His mind and style had been formed by Niels Bohr, the physicist, philosopher, poet, and incessant Socratic questioner who made Copenhagen one of the capital cities of science between the wars. Delbrücks ideas about the physical properties of the gene, in a youthful paper of 1935, had led [Austrian physicist Erwin] Schrödinger to write [the influential book] What Is Life? Delbrück was perhaps the earliest of the theoretical physicists who have crossed over to biology; Szilard, [Francis] Crick, Maurice Wilkins were others, while Linus Pauling, arriving at biology from a different tangent, was a physical chemist whose strength was founded in quantum mechanics. The move from physics has been the intellectual immigration that has mattered most to biology [my italics].

Each of us who has emigrated from physics to biology has followed in the footsteps of giants such as Szilard and Delbrück. We each follow our own individual path, but share a common bond. Physicists have played key roles in biology, and will continue to do so.  

Friday, November 4, 2022

The International Day of Medical Physics, Held on Marie Curie's Birthday

The poster for the 2022
International Day of Medical Physics

Monday, November 7, is the International Day of Medical Physics. The purpose of this annual event, organized by the International Organization for Medical Physics, is to raise awareness about the role that medical physics plays in our lives. The date coincides with the birthday of Marie Curie.

The Search for the Elements,
by Isaac Asimov.
To celebrate the International Day of Medical Physics, I quote an excerpt from Isaac Asimov’s book The Search for the Elements that describes Curie’s discovery of the elements polonium and radium.

Thomson, Roentgen, Becquerel, and Rutherford all received Nobel prizes for their work. But the most glamorous of all the Nobel laureates of the turn of the century was Marie Curie, born Marja Sklodowska in Poland in 1867. Marie went to Paris to get an education (at the Sorbonne), and there she met and married a French chemist, Pierre Curie.

Becquerel’s discovery of the radiations from uranium fascinated Marie; it was she who suggested the term “radioactivity.” With enthusiasm and imagination, she plunged into a career of investigating this phenomenon. Marie began by trying to measure the strength of radioactivity. As the instrument of measurement she used the phenomenon of piezoelectricity, involving the electrical behaviors of crystals, which had been discovered by Pierre Curie. Pierre, realizing perhaps that his wife was a greater scientist than he was, abandoned his own research and joined her.

As they measured the radioactivity of samples of uranium ore, they found to their surprise that some samples were many times more radioactive than could be accounted for by the uranium content. This could only mean that other radioactive elements also were present. But if so, the amount must be extremely small, because the Curies were unable to detect any by ordinary chemical analysis. So they decided they would have to collect huge quantities of the ore to get enough of the trace material to analyze. They managed to get tons of ore from the mines in Bohemia; the Austrian government had no use for it and was glad to give it away, provided the Curies paid for the transportation. This took almost all their life savings.

They set up shop in a little unheated shed and went to work on their mounds and mounds of uranium ore. Year after year they kept concentrating the radioactivity, discarding inactive material and working with the active. (Marie took time out to have a baby, Irene, who later turned out to be a great scientist on her own.) At last, in July 1898, they succeeded in boiling down their tons of ore to a highly radioactive residue. What they had was a pinch of black powder which was 400 times more radioactive than the same quantity of pure uranium would have been. In this bit of stuff they found a new element resembling tellurium. Mendeleev might have named it “eka-tellurium.” The Curies called it “polonium,” after Marie’s native land.

This element didn’t account for all the radioactivity, however. A still more active element must be hiding in their ore. Six months later they finally concentrated that element. Its properties were like those of barium. The element fitted into row IIa in the seventh period of Mendeleev’s table. It was the first new element discovered in the seventh period since Berzelius had found thorium 60 years before.

The Curies called the new element “radium,” because of its powerful radioactivity.

Pierre Curie died in 1906 as the result of a traffic accident (involving a horse-drawn cab, not one of the new-fangled motor cars). Marie took over his professorship at the Sorbonne and carried on alone. She was the first woman professor in the history of that proud institution. Moreover, she was the only scientist in history to receive two Nobel prizes—one in physics (shared with her husband and Becquerel) for their accurate measurements of radioactivity, and one in chemistry for the discovery of polonium and radium.

International Organization of Medical Physics President Message on the International Day of Medical Physics 2022. 

https://www.youtube.com/watch?v=LZcEZYkUsCo


Marie Curie: Scientist

https://www.youtube.com/watch?v=ZEV4KJBJvEg

Friday, October 28, 2022

The Boundary Layer

In Chapter 1 of Intermediate Physics for Medicine and Biology, Russ Hobbie and I introduce a concept from fluid dynamics called the boundary layer.
The behavior of a sphere moving through a fluid illustrates how flow behavior depends on Reynolds number... At very high Reynolds number, viscosity is small but still plays a role because of the no-slip boundary condition at the sphere surface. A thin layer of fluid, called the boundary layer, sticks to the solid surface, causing a large velocity gradient and therefore significant viscous drag.
Life in Moving Fluids,
by Steven Vogel.
For readers who want to know more about the boundary layer, let me quote the start of Chapter 8 of Steven Vogel’s masterpiece Life in Moving Fluids.
At the interface between a stationary solid and a moving fluid, the velocity of the fluid is zero. This, of course, defines the no-slip condition… The immediate corollary of the no-slip condition is that near every such surface is a gradient in the speed of flow. Entirely within the fluid, speed changes from that of the solid to what we call the “free stream” velocity some distance away. Shearing motion is inescapably associated with a gradient in speed, so in these gradients near surfaces, viscosity, fluids’ antipathy to shear, works its mischief, giving rise to skin friction and consequent power consumption. The gradient region is associated with the term “boundary layer”…

The boundary layer… wasn’t so much discovered as it was invented, in the early part of this century, as a great stroke of genius of Ludwig Prandtl. Recognizing the origin of this notion is crucial. In the basic differential equations for moving fluids, the Navier-Stokes equations, some terms result from the inertia of fluids and some from their viscosity… The Reynolds number gives an indication of the relative importance of inertia and viscosity… At Reynolds numbers below unity, inertia can be ignored and nicely predictive rules nonetheless derived—[such as] Stokes’ law for the drag of a sphere… At high Reynolds number, one might expect to get away with neglecting viscosity… It may sound neat, but it all too commonly gets us in trouble—results diverge from physical reality, drag vanishes, and d’Alembert has his paradox.

Prandtl reconciled practical and theoretical fluid mechanics at high Reynolds numbers by recognizing that viscosity could never be totally ignored. What changes with Reynolds number was where it had to be taken into account; initially it mattered everywhere, but as the Reynolds number increased well above unity, viscosity made a difference only in the gradient regions near surfaces. These regions might be small, and they might get ever smaller… as the Reynolds number increased; but as long as the no-slip condition held, a place had to exist where shear rates were high and viscosity was significant. Prandtl called the place in question… the “boundary layer.” In general, a higher Reynolds number implies a thinner boundary layer but a higher shear rate in that boundary layer.

To learn more about the biological significance of the boundary layer see the Chapter 9 in Life in Moving Fluids, which is all about “Life in Velocity Gradients.”

Boundary Layer Theory,
by Schlichting and Gersten
If you want a more rigorous and mathematical analysis of boundary layers, I recommend Boundary Layer Theory by Hermann Schlichting and his student Klaus Gersten. The eighth edition of this book (2000) is cited in IPMB; a revised and updated ninth edition was published in 2017. Schlichting and Gersten write
At the end of the 19th century, fluid mechanics had split into two different directions which hardly had anything more in common. On one side was the science of theoretical hydrodynamics, emanating from Euler’s equations of motion and which had been developed to great perfection. However this had very little practical importance, since the results of this so-called classical hydrodynamics were in glaring contradiction to everyday experience. This was particularly true in the very important case of pressure loss in tubes and channels, as well as that of the drag experienced by a body moved through a fluid. For this reason, engineers, on the other side, confronted by the practical problems of fluid mechanics, developed their own strongly empirical science, hydraulics. This relied upon a large amount of experimental data and differed greatly from theoretical hydrodynamics in both methods and goals.

It is the great achievement of [German scientist] Ludwig Prandtl [1875–1953] which, at the beginning of this century, set forth the way in which these two diverging directions of fluid mechanics could be unified. He achieved a high degree of correlation between theory and experiment, which, in the first half of this century, has led to unimagined successes in modern fluid mechanics. It was already known then that the great discrepancy between the results in classical hydrodynamics and reality was, in many cases, due to neglecting the viscosity effects in the theory. Now the complete equations of motion of viscous flows (the Navier Stokes equations) had been known for some time. However, due to the great mathematical difficulty of these equations, no approach had been found to the mathematical treatment of viscous flows (except in a few special cases). For technically important fluids such as water and air, the viscosity is very small, and thus the resulting viscous forces are small compared to the remaining forces (gravitational force, pressure force). For this reason it took a long time to see why the viscous forces ignored in the classical theory should have an important effect on the motion of the flow.

In his lecture on “Über Flüssigkeitbewegung bei sehr kleiner Reibung” (On Fluid Motion with Very Small Friction) at the Heidelberg mathematical congress in 1904, L. Prandtl... showed how a theoretical treatment could be used on viscous flows in cases of great practical importance. Using theoretical considerations together with some simple experiments, Prandtl showed that the flow past a body can be divided into two regions: a very thin layer close to the body (boundary layer) where the viscosity is important, and the remaining region outside this layer where the viscosity can be neglected. With the help of this concept, not only was a physically convincing explanation of the importance of the viscosity in the drag problem given, but simultaneously, by hugely reducing the mathematical difficulty, a path was set for the theoretical treatment of viscous flows. Prandtl supported his theoretical work by some very simple experiments in a small, self–built water channel, and in doing this reinitiated the lost connection between theory and practice. The theory of the Prandtl boundary layer or the frictional layer has proved to be exceptionally useful and has given considerable stimulation to research into fluid mechanics since the beginning of this century. Under the influence of a thriving flight technology, the new theory developed quickly and soon became, along with other important advances—airfoil theory and gas dynamics—a keystone of modern fluid mechanics.

Introductory Fluid Mechanics L19 p2 — The Boundary Layer Concept.

https://www.youtube.com/watch?v=k37vPSA3E1g


E. Bodenschatz — Ludwig Prandtl (1875–1953)

https://www.youtube.com/watch?v=cv952Nhc_vs

Friday, October 21, 2022

Maurice de Broglie and the First Observation of an X-ray Absorption Edge

If you shine x-rays through a material and measure the number absorbed by it, you create an x-ray absorption spectrum. The absorption is related to the cross section; the bigger the cross section, the more the x-rays are absorbed. Figure 15.2 from Intermediate Physics for Medicine and Biology is shown below, where the cross section for carbon is plotted as a function of the x-ray energy. I’ve drawn an oval around what’s the most interesting feature of the plot, the jump in the cross section at an energy of about 0.28 keV. This abrupt rise is known as the K edge, and is an example of an absorption edge

Figure 15.2 from Intermediate Physics for Medicine and Biology.
A slightly modified version of Figure 15.2 from
Intermediate Physics for Medicine and Biology.

The cross section jumps up when the photon’s energy rises above the binding energy of a K-shell electron [an electron in the innermost energy level]. It’s not a small effect; the cross section increases by more than a factor of ten at the K edge (note that this is a log-log plot). 

When I see such a dramatic effect, I imagine how surprising it must have been for the person who observed it first. Who was the person who discovered the K edge? Maurice de Broglie.

Maurice de Broglie
Maurice de Broglie in 1932.
Maurice was the elder brother of the more-famous Louis de Broglie, who Russ Hobbie and I mention when talking about electron waves and the electron microscope. Maurice was born in Paris in 1875. After more than a decade in the French navy, he left the military to study physics. He was interested in x-rays, which were discovered by Wilhelm Röntgen in 1895. In 1913, Maurice published the first observation of an absorption edge (Comptes Rendus, Volume 157, Pages 924–926). When World War I began, he went back to the navy to do research on detecting U-boats (German submarines). After a long career in science, including being awarded the Hughes Medal by the Royal Society of London, he died in 1960 at the age of 85.

Farrel Lytle, an x-ray spectroscopy pioneer, tells Maurice’s story in his review article (Journal of Synchrotron Radiation, Volume 6, Pages 123–134, 1999).

Although Röntgen represents the beginning of X-ray science, the remarkable de Broglie royal family has been significant in both the world of science and the history of France. It has been said that if Maurice did nothing more than convince his younger brother, Louis, to drop his study of history and begin a career in science, he should be memorialized for that alone. But he did considerably more than that. His work in X-ray and atomic physics was innovative and important. Maurice had begun a career as a naval officer, but became interested in the exciting new world of X-rays and physics and resigned his commission. Beginning in the laboratory of Paul Langevin working on the ionization of gases by X-rays, he later built his own laboratory in his personal mansion on rue Châteaubriand. There he became the first in France to work with X-ray diffraction. During these experiments he invented X-ray spectroscopy. The experimental innovation came about when he mounted a single crystal on the cylinder of a recording barometer where the clockwork mechanism rotated it around its vertical axis at 2° h−1. As the crystal rotated, all angles between the incident beam and the diffraction planes (hence, all X-ray energies) were recorded on a photographic plate. In this way he obtained an X-ray line spectrum from the tube with sharp and diffuse lines, bands etc. Two of the absorption bands proved to be the K edges of Ag and Br in the photographic emulsion. This was the first observation of an absorption edge (de Broglie, 1913). It took a few more experiments to reach the correct interpretation of the absorption edges. After the end of the First World War, Maurice gathered a large group of young scientists, all working on X-ray diffraction or X-ray spectroscopy, at the laboratory in his home. Joining him in his work were, among others, Alexandre Dauvillier, Jean Thibaud, Jean-Jacques Trillat, Louis Leprince-Ringuet (all were major contributors to the field of X-ray science) and his young brother, Louis. Maurice’s scientific work and his social position soon made him a major player in the science world.
Apparently it took a while to figure out that the absorption edges belonged to materials in the photographic film and not the x-ray tube or the crystal, but eventually it was all sorted out. A German scientist, Julius Hedwig (1879–1936), independently studied x-ray spectroscopy, and may have observed an x-ray absorption edge before Maurice, but he soon abandoned the work while Maurice pursued it further, becoming the father of x-ray spectroscopy.

Friday, October 14, 2022

Paul Horowitz Discusses The Art of Electronics

The Art of Electronics,
by Horowitz and Hill.
Nine years ago I wrote in this blog about the second edition of Horowtiz and Hill’s textbook The Art of Electronics. At the end of that post I hinted that a new edition of their book was in the works. The third edition of The Art of Electronics appeared in 2015, just in time for Russ Hobbie and me to cite it in the fifth edition of Intermediate Physics for Medicine and Biology.

Recently, I stumbled upon a delightful YouTube video of an interview with Paul Horowitz, explaining how The Art of Electronics began. I’ll keep this post brief, so you’ll have time to watch the video. The host is Limor Fried, who goes by the moniker Ladyada in honor of computer programing pioneer Ada Lovelace. Fried owns the electronics company Adafruit Industries, which is a cross between a business and an educational organization. Notice that during the interview Fried wears a “transistor man” tee shirt; I remember reading about transistor man in The Art of Electronics when I was designing a circuit in John Wikswo’s lab during graduate school.

Enjoy the video, and make The Art of Electronics your go-to book for designing circuits; or, just read it for fun.

Ladyada interview with Paul Horowitz, author of The Art of Electronics.
  https://www.youtube.com/watch?v=iCI3B5eT9NA


Meet Limor “Ladyada” Fried at Adafruit Industries.
  https://www.youtube.com/watch?v=SpYMgScKRwk