Friday, June 25, 2021

Cerenkov Luminescence Imaging: Physics Principles and Potential Applications in Biomedical Sciences

When a particle travels faster than the speed of light, it emits Cerenkov radiation. This phenomenon has resulted in new medical imaging applications, as described in a 2017 review paper by Esther Ciarrocchi and Nicola Belcari (Cerenkov Luminescence Imaging: Physics Principles and Potential Applications in Biomedical Sciences, EJNMMI Physics, Volume 4, Article 14). This is an open access article, so you can read it for free.

Russ Hobbie and I don’t discuss Cerenkov Luminescence Imaging in Intermediate Physics for Medicine and Biology, but you can learn a lot about it using the physics we do discuss. For example, can particles  travel faster than the speed of light? They can’t travel faster than the speed of light in a vacuum, but they can travel faster than the speed of light in a material such as water or tissue where light is slowed and the medium has an index of refraction. Below is a new homework problem, in which we consider electrons emitted in tissue by beta decay of the isotope iodine-131, used in many medical applications.
Problem 9 ¼. The end point kinetic energy (see Fig. 17.8) for beta decay of 131I is 606 keV, and tissue has an index of refraction of 1.4. Do any of the emitted electrons have a speed faster than the speed of light in the tissue? To determine this speed, use Eq. 14.1. Because the electrons move near the speed of light, to determine their speed as a function of their kinetic energy use a result from special relativity, Eq. 17.1.

For those who don’t have IPMB at your side (shame on you!), Eq. 14.1 is cn = c/n, where cn is the speed of light in the medium, c is the speed of light in a vacuum (3 × 10⁸ m/s), and n is the index of refraction, and Eq. 17.1 is T + mc2 = mc2/√(1 − v2/c2), where v is the speed of the particle, T is its kinetic energy, and mc2 is the rest mass of an electron expressed as energy (511 keV).

If you solved this problem correctly, you found that some of the more energetic electrons emitted during beta decay of 131I do travel faster than the speed of light in tissue.

Cerenkov radiation is emitted at an angle θ with respect to the direction that the particle is moving. This distribution of light is characteristic of a shock wave, and is similar to the distribution of sound in a sonic boom made by a plane when it flies faster than the speed of sound. The new problem below requires the reader to calculate θ.

Problem 9 ½. The drawing below shows a particle moving to the right faster than the speed of light in the medium. The position of the particle at several instants is indicated by the purple dots. The location of light emitted by the particle at each position is shown by the black circles. The light adds to form a conical wave front, shown by the green lines. 
(a) Use the red right triangle to calculate the angle θ as a function of the particle speed, v, and the index of refraction, n
(b) Compute the value of θ for the fastest electrons emitted by beta decay of 131I in tissue.

The number of photons emitted tends to be greatest at short wavelengths, so Cerenkov radiation often has a blue tinge. However, readers of IPMB learned in Chapter 14 that the spectrum of radiation can look different when viewed as a function of frequency (or energy) rather than as a function of wavelength. Below is a new problem to explore this effect.

Problem 9 ¾. The number of photons dN emitted with a wavelength between λ and λ + is approximately dN = C/λ2, where C is a constant.
(a) Sketch a plot of dN/ versus λ. Don’t worry about the scale of the axes (in other words, don't worry about the value of C); just make the plot qualitatively correct. 
(b) Use methods similar to those introduced in Section 14.8 to determine the number of photons emitted with an energy between E and E + dE. Don’t worry about constant factors, just determine how dN/dE varies with E
(c) Sketch a plot of dN/dE versus E. Again, just make the plot qualitatively correct.

If you solved part (c) correctly, you should have drawn a plot with a flat line, because dN/dE is independent of E. Of course, there must be some limits to this result, otherwise the particle would emit an infinite amount of energy when integrated over all photon energies. See Ciarrocchi and Belcari’s review for an explanation.

Perhaps the most interesting part of Ciarrocchi and Belcari’s article is their discussion of biomedical applications. You can use Cerenkov radiation to image beta emitters like 131I, positron emitters like 18F used in positron emission tomography, and high-energy protons required for proton therapy.

To learn more about Cerenkov radiation, watch this video by Don Lincoln. Enjoy!

How does Cerenkov radiation work?

https://www.youtube.com/watch?v=Yjx0BSXa0Ks

Friday, June 18, 2021

Science-Based Medicine

Why is my field—bioelectromagnetics—so prone to pseudoscience? I don’t know. But I do know that we need to be more skeptical about alternative medical treatments. That’s why I’m a fan of the website sciencebasedmedicine.org.
Science-Based Medicine is dedicated to evaluating medical treatments and products of interest to the public in a scientific light, and promoting the highest standards and traditions of science in health care. Online information about alternative medicine is overwhelmingly credulous and uncritical, and even mainstream media and some medical schools have bought into the hype and failed to ask the hard questions.

We provide a much needed “alternative” perspective—the scientific perspective.

Good science is the best and only way to determine which treatments and products are truly safe and effective. That idea is already formalized in a movement known as evidence-based medicine (EBM). EBM is a vital and positive influence on the practice of medicine, but it has limitations and problems in practice: it often overemphasizes the value of evidence from clinical trials alone, with some unintended consequences, such as taxpayer dollars spent on “more research” of questionable value. The idea of SBM is not to compete with EBM, but a call to enhance it with a broader view: to answer the question “what works?” we must give more importance to our cumulative scientific knowledge from all relevant disciplines.

To me, this means that medical claims must not violate the laws of physics. Some do. For instance, magnetic therapy suggests that permanent magnets can prevent many diseases. Powerline (60 Hz) magnetic fields are said to cause cancer. A few people claim to be hypersensitive to weak electromagnetic fields. Many people believe that electromagnetic radiation associated with cell phones is dangerous. This belief has increased recently with the development of 5G technology. Somehow (and this is really weird), doubts about covid-19 vaccines became mixed up with these 5G concerns.

Yet, bioelectromagnetics has enormous potential for medical applications: cardiac pacing and defibrillation, transcranial magnetic stimulation, functional electrical stimulation, deep brain stimulation, and prostheses such as cochlear implants.

How do we separate the wheat from the chaff? It’s not easy. Reading Intermediate Physics for Medicine and Biology is a good place to start. Many of these readers would benefit from a short course about science-based medicine. Does such a course exist? Yes! Harriet Hall (the SkepDoc, who I discussed previously in this blog) has recorded a series of ten videos about science-based medicine. She debunks much of the nonsense out there. Below, I link to the videos. Your homework assignment is to watch them.

If the coronavirus pandemic has taught us anything, it’s that we must base medicine on science.

 
Lecture 1: Science-based medicine versus evidence-based medicine

 
Lecture 2: Complimentary and alternative medicine
 
 
Lecture 3: Chiropractic

 
Lecture 4: Acupuncture
 
 
Lecture 5: Homeopathy
 
 
Lecture 6: Naturopathy
 
 
Lecture 7: Energy medicine
 
 
Lecture 8: Miscellaneous
 
 
Lecture 9: Pitfalls in research
 
 
Lecture 10: The media and politics

Friday, June 11, 2021

Inspire

I suspect you’ve seen some of the recent ads for Inspire, a new treatment for obstructive sleep apnea.

An Inspire TV ad. 

https://www.youtube.com/watch?v=bn5-ydF4_QQ 

How does Inspire work? It uses electrical stimulation, like Russ Hobbie and I discuss in Chapter 7 of Intermediate Physics for Medicine and Biology.

7.10 Electrical Stimulation

The information that has been developed in this chapter can also be used to understand some of the features of stimulating electrodes. These may be used for electromyographic studies; for stimulating muscles to contract called functional electrical stimulation (Peckham and Knutson 2005); for a cochlear implant to partially restore hearing (Zeng et al.2008); deep brain stimulation for Parkinson’s disease (Perlmutterand Mink 2006); for cardiac pacing (Moses andMullin 2007); and even for defibrillation (Dosdall et al.2009).

Like the cardiac pacemaker, the Inspire device is implanted in the upper chest. Instead of monitoring the electrocardiogram, the device monitors breathing; instead of stimulating the heart, it stimulates the hypoglossal nerve controlling muscles in the tongue.

A patient with obstructive sleep apnea has their airway blocked while sleeping, causing the body to crave oxygen. This results in a brief reawakening as the person opens their airway for better airflow. Once oxygen is restored, the patient goes back to sleep. Then, the entire process starts again, so sleep is frequently and repeatedly interrupted.

One way to treat obstructive sleep apnea is using continuous positive airway pressure (CPAP), which requires wearing a mask attached by a hose to a pump. Some people can’t or won’t tolerate CPAP, and it’s hard to imagine that anyone likes it.

When Inspire detects that you’re taking a breath it stimulates the tongue to contract, opening the airway. You only need it when sleeping, so it has a button you can push to turn it on before bed and turn it off when you wake up.

Inspire is yet one more example of how physics can be applied to medicine, and in particular how electrical stimulation can be used to treat patients. I’m into it. 

Dr. Ryan Soose explains the Stimulation Therapy for Apnea Reduction (STAR) clinical trial.

https://www.youtube.com/watch?v=AvQoxv7iDP4

Friday, June 4, 2021

The Bidomain Model of Cardiac Tissue: Predictions and Experimental Verification

“The Bidomain Model of Cardiac Tissue: Predictions and Experimental Verification” superimopsed on Intermediate Physics for Medicine and Biology.
“The Bidomain Model of Cardiac Tissue:
Predictions and Experimental Verification”

In the early 1990s, I was asked to write a chapter for a book titled Neural Engineering. My chapter had nothing to do with nerves, but instead was about cardiac tissue analyzed with the bidomain model. (You can learn more about the bidomain model in Chapter 7 of Intermediate Physics for Medicine and Biology.) 

“The Bidomain Model of Cardiac Tissue: Predictions and Experimental Verification” was submitted to the editors in January, 1993. Alas, the book was never published. However, I still have a copy of the chapter, and you can download it here. Now—after nearly thirty years—it’s obsolete, but provides a glimpse into the pressing issues of that time.

I was a impudent young buck back in those days. Three times in the chapter I recast the arguments of other scientists (my competitors) as syllogisms. Then, I asserted that their premise was false, so their conclusion was invalid (I'm sure this endeared me to them). All three syllogisms dealt with whether or not cardiac tissue could be treated as a continuous tissue, as opposed to a discrete collection of cells.

The Spach Experiment

The first example had to do with the claim by Madison Spach that the rate of rise of the cardiac action potential, and time constant of the action potential foot, varied with direction.

Continuous cable theory predicts that the time course of the action potential does not depend on differences in axial resistance with direction.

The rate of rise of the cardiac wave front is observed experimentally to depend on the direction of propagation.

Therefore, cardiac tissue does not behave like a continuous tissue.
I then argued that their first premise is incorrect. In one-dimensional cable theory, the time course of the action potential doesn’t depend on axial resistance, as Spach claimed. But in a three-dimensional slab of tissue superfused by a bath, the time course of the action potential depends on the direction of propagation. Therefore, I contended, their conclusion didn’t hold; their experiment did not prove that cardiac tissue isn’t continuous. To this day the issue is unresolved.

Defibrillation

A second example considered the question of defibrillation. When a large shock is applied to the heart, can its response be predicted using a continuous model, or are discrete effects essential for describing the behavior?
An applied current depolarizes or hyperpolarizes the membrane only in a small region near the ends of a continuous fiber.

For successful defibrillation, a large fraction of the heart must be influenced by the stimulus.

Therefore, defibrillation cannot be explained by a continuous model.
I argued that the problem is again with the first premise, which is true for tissue having “equal anisotropy ratios” (the same ratio of conductivity parallel and perpendicular to the fibers, in both the intracellular and extracellular spaces), but is not true for “unequal anisotropy ratios.” (Homework Problem 50 in Chapter 7 of IPMB examines unequal anisotropy ratios in more detail). If the premise is false, the conclusion is not proven. This issue is not definitively resolved even today, although the sophisticated simulations of realistically shaped hearts with their curving fiber geometry, performed by Natalia Trayanova and others, suggest that I was right.

Reentry Induction

The final example deals with the induction of reentry by successive stimulation through a point electrode. As usual, I condensed the existing dogma to a syllogism.
In a continuous tissue, the anisotropy can be removed by a coordinate transformation, so reentry caused by successive stimulation through a single point electrode cannot occur, since there is no mechanism to break the directional symmetry.

Reentry has been produced experimentally by successive stimulation through a single point electrode.

Therefore, cardiac tissue is not continuous.

Once again, that pesky first premise is the problem. In tissue with equal anisotropy ratios you can remove anisotropy by a coordinate transformation, so reentry is impossible. However, if the tissue has unequal anisotropy ratios the symmetry is broken, and reentry is possible. Therefore, you can’t conclude that the observed induction of reentry by successive stimulation through a point electrode implies the tissue is discrete.


I always liked this book chapter, in part because of the syllogisms, in part because of its emphasis on predictions and experiments, but mainly because it provides a devastating counterargument to claims that cardiac tissue acts discretely. Although it was never published, I did send preprints around to some of my friends, and the chapter took on a life of its own. This unpublished manuscript has been cited 13 times!

Trayanova N, Pilkington T (1992) “The use of spectral methods in bidomain studies,” Critical Reviews in Biomedical Engineering, Volume 20, Pages 255–277.

Winfree AT (1993) “How does ventricular tachycardia turn into fibrillation?” In: Borgreffe M, Breithardt G, Shenasa M (eds), Cardiac Mapping, Mt. Kisco NY, Futura, Chapter 41, Pages 655–680.

Henriquez CS (1993) “Simulating the electrical behavior of cardiac tissue using thebidomain model,” Critical Reviews of Biomedical Engineering, Volume 21, Pages 1–77.

Wikswo JP (1994) “The complexities of cardiac cables: Virtual electrode effects,” Biophysical Journal, Volume 66, Pages 551–553.

Winfree AT (1994) “Puzzles about excitable media and sudden death,” Lecture Notes in Biomathematics, Volume 100, Pages 139–150.

Roth BJ (1994) “Mechanisms for electrical stimulation of excitable tissue,” Critical Reviews in Biomedical Engineering, Volume 22, Pages 253–305.

Roth BJ (1995) “A mathematical model of make and break electrical stimulation ofcardiac tissue by a unipolar anode or cathode,” IEEE Transactions on Biomedical Engineering, Volume 42, Pages 1174–1184.

Wikswo JP Jr, Lin S-F, Abbas RA (1995) “Virtual electrodes in cardiac tissue: A common mechanism for anodal and cathodal stimulation,” Biophysical Journal, Volume 69, Pages 2195–2210.

Roth BJ, Wikswo JP Jr (1996) “The effect of externally applied electrical fields on myocardial tissue,” Proceedings of the IEEE, Volume 84, Pages 379–391.

Goode PV, Nagle HT (1996) “On-line control of propagating cardiac wavefronts,” The 18th Annual International Conference of the IEEE Engineering in Medicine and Biology Society, Amsterdam.

Winfree AT (1997) “Rotors, fibrillation, and dimensionality,” In: Holden AV, Panfilov AV (eds): Computational Biology of the Heart, Chichester, Wiley, Pages 101–135.

Winfree AT (1997) “Heart muscle as a reaction-diffusion medium: The roles of electric potential diffusion, activation front curvature, and anisotropy,” International Journal of Bifurcation and Chaos, Volume 7, Pages 487–526.

Winfree AT (1998) “A spatial scale factor for electrophysiological models of myocardium,” Progress in Biophysics and Molecular Biology, Volume 69, Pages 185–203.
I’ll end with the closing paragraph of the chapter.
The bidomain model ignores the discrete nature of cardiac cells, representing the tissue as a continuum instead. Experimental evidence is often cited to support the hypothesis that the discrete nature of the cells plays a key role in cardiac electrophysiology. In each case, the bidomain model offers an alternative explanation for the phenomena. It seems wise at this point to reconsider the evidence that indicates the significance of discrete effects in healthy cardiac tissue. The continuous bidomain model explains the data, recorded by Spach and his colleagues, showing different rates of rise during propagation parallel and perpendicular to the fibers, anodal stimulation, arrhythmia development by successive stimulation from a point source, and possibly defibrillation. Of course, these alternative explanations do not imply that discrete effects are not responsible for these phenomena, but only that two possible mechanisms exist rather than one. Experiments must be found that differentiate unambiguously between alternative models. In addition, discrete junctional resistance must be incorporated into the bidomain model. Only when such experiments are performed and the models are further developed will we be able to say with any certainty that cardiac tissue can be described as a continuum.

Friday, May 28, 2021

Insulin

A drawing of insulin by David Goodsell, from Wikipedia.
 
Chapter 10 of Intermediate Physics for Medicine and Biology discusses feedback. The homework problems of that chapter include an example of the classic feedback loop controlling the amount of glucose in the blood by the hormone insulin

A Short History of Biology, by Isaac Asimov, superimposed on Intermediate Physics for Medicine and Biology.
A Short History of Biology,
by Isaac Asimov.
Insulin was isolated and first used to treat diabetes in 1921, one hundred years ago. To celebrate this landmark, I will quote a few paragraphs from the section on blood hormones in Isaac Asimov’s A Short History of Biology.
The most spectacular early result of hormone work… was in connection with the disease, diabetes mellitus. This involved a disorder in the manner in which the body broke down sugar for energy, so that a diabetic accumulated sugar in his blood to abnormally high levels. Eventually, the body was forced to get rid of the excess sugar through the urine, and the appearance of sugar in the urine was symptomatic of an advanced stage of the disease. Until the twentieth century, the disease was certain death.

Suspicion arose that the pancreas was somehow connected with the disease, for in 1893, two German physiologists, Joseph von Mering (1849–1908) and Oscar Minkowski (1858–1931), had excised the pancreas of experimental animals and found that severe diabetes developed quickly. Once the hormone concept had been propounded by Starling and Bayliss, it seemed logical to suppose that the pancreas produced a hormone which controlled the manner in which the body broke down sugar.

Attempts to isolate the hormone from the pancreas… failed, however. Of course, the chief function of the pancreas was to produce digestive juices, so that it had a large content of protein-splitting enzymes. If the hormone were itself a protein (as, eventually, it was found to be) it would break down in the very process of extraction.

In 1920, a young Canadian physician, Frederick Grant Banting (1891–1941), conceived the notion of tying off the duct of the pancreas in the living animal and then leaving the gland in position for some time. The digestive-juice apparatus of the gland would degenerate, since no juice could be delivered, while those portions secreting the hormone directly into the blood stream would (he hoped) remain effective. In 1921, he obtained some laboratory space at the University of Toronto and with an assistant, Charles Herbert Best (1899–[1978]), he put his notion into practice. He succeeded famously and isolated the hormone “insulin.” The use of insulin has brought diabetes under control, and while a diabetic cannot be truly cured even so and must needs submit to tedious treatment for all his life, that life is at least a reasonably normal and prolonged one.
Charles Best and Frederick Banting, circa 1924, University of Toronto Library, from Wikipedia.

Where does physics, engineering, and technology enter this story? Consider the insulin pump. This modern medical device includes a battery-powered pump, an insulin reservoir, and a cannula and tubing for delivery of the insulin under the skin. It is controlled by a computer the size of a cell phone.
 
To learn more about the discovery of insulin, see the University of Toronto website: https://insulin100.utoronto.ca.

Happy 100th birthday, insulin! 

New Heritage Minute: The Discovery of Insulin.

Friday, May 21, 2021

Digital Subtraction Angiography

In Chapter 16 of Intermediate Physics for Medicine and Biology, Russ Hobbie and I discuss digital subtraction angiography.
16.6 Angiography and Digital Subtraction Angiography

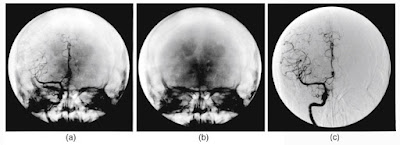
One important problem in diagnostic radiology is to image portions of the vascular tree. Angiography can confirm the existence of and locate narrowing (stenosis), weakening and bulging of the vessel wall (aneurysm), congenital malformations of vessels, and the like. This is done by injecting a contrast material containing iodine into an artery. If the images are recorded digitally, it is possible to subtract one without the contrast medium from one with contrast and see the vessels more clearly (Fig. 16.23).
Digital subtraction angiography. Figure 16.23 in Intermediate Physics for Medicine and Biology.
Figure 16.23 in Intermediate Physics for Medicine and Biology. Digital subtraction angiography. (a) Brain image with contrast material. (b) Image without contrast material. (c) The difference image. Anterior view of the right internal carotid artery. Photograph courtesy of Richard Geise, Department of Radiology, University of Minnesota.

One of the pioneers of digital subtraction angiography was Charles Mistretta. The first two paragraphs in the introduction of his article “Digital Angiography: A Perspective” (Radiology, Volume 139, Pages 273-276, 1981) puts his work into perspective (references removed).
Within weeks of Roentgen’s discovery of the x-ray in 1895, Haschek and Lindenthal performed post-mortem arteriography in a hand. For the next 60 years, radiology in general and angiography in particular were largely limited to using film as a means for permanent recording of x-ray images. Recently, new technical developments in television, digital electronics, and image intensifier design have improved the electronic recording of images, and have caused renewed interest in the techniques of intravenous angiocardiography and arteriography originally described by Castellanos et al. [and] Robb and Steinberg.

Prior to 1970, applications involving the subtraction of unprocessed video information stored on analog discs or tape were common. These methods were adequate for augmentation of arterial injection techniques but were not sensitive enough to be used in conjunction with intravenous injection of contrast media. However, techniques capable of imaging the small contrast levels produced after an intravenous injection of contrast media were reported by Ort et al. and Kelcz et al. In combination with analog storage devices, these investigators used both time and K-edge energy subtraction methods for iodine imaging. In spite of their greater sensitivity, the poor reliability of those analog systems made them unsuitable for clinical use and lead to the design of the University of Wisconsin digital video image processor. Over the next five years, this processor was used by a number of investigators for a variety of energy and time subtraction studies both in animals and humans…
Mistretta is now professor emeritus in the Department of Radiology at the University of Wisconsin, where he has been doing medical imaging research since 1971. Students will benefit from his advice for young medical physicists presented in a spotlight article from the University of Wisconsin.
Choose a career and position that you enjoy and that you are eager to go to every day. Pick a career that makes a difference in the world and hopefully helps people. When you get old some day and start becoming aware of your mortality, it really helps to look back and say “I did my best and I helped make the world a little better place”. As medical physicists we have an excellent chance of making this come true.

Friday, May 14, 2021

A Bifurcation Diagram for the Heart

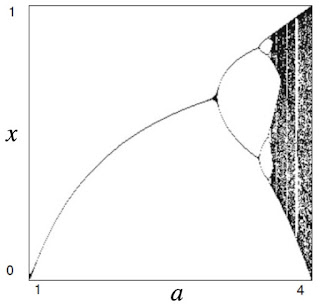
In Figure 10.26 of Intermediate Physics for Medicine and Biology, Russ Hobbie and I plot a bifurcation diagram for the logistic map: xj+1 = a xj (1 − xj).

A bifurcation diagram for the logistic map. Figure 10.26 in Intermediate Physics for Medicine and Biology.
A bifurcation diagram for the logistic map, showing 300 values of xj for values of a between 1 and 4. Figure 10.26 in Intermediate Physics for Medicine and Biology.

The bifurcation diagram summarizes the behavior of the map as a function of the parameter a. Some values of a correspond to a steady state, others represent period doubling, and still others lead to chaos.

When I teach Biological Physics, I don’t introduce chaos using the logistic map. Instead, I solve IPMB’s Homework Problem 41, about cardiac restitution and the onset of fibrillation.

Homework Problem 41 from Chapter 10 of Intermediate Physics for Medicine and Biology.

While Problem 41 provides insight into chaos and its relation to cardiac arrhythmias, Russ and I don’t draw a bifurcation diagram that summarizes how the action potential duration, APD, depends on the cycle length, CL (the time between stimuli, it’s the parameter analogous to a in the logistic map). In this post I present such a diagram.

A bifurcation diagram associated with Homework Problem 41 in Intermediate Physics for Medicine and Biology.
A bifurcation diagram associated with Homework Problem 41 in Intermediate Physics for Medicine and Biology. The plot shows 20 values of APDj for values of CL between 100 and 400 ms.

I don’t have the software to create a beautiful diagram like in Fig. 10.26, so I made one using MATLAB. It doesn’t have as much detail as does the diagram for the logistic map, but it’s still helpful.

The region marked 1:1 (for CL = 310 to 400 ms) implies steady-state behavior: Each stimulus excites an action potential with a fixed duration. Transients existed before the system settled down to a steady state, so I discarded the first 10,000 iterations before I plotted 20 values of APDj (j = 10,001 to 10,020). 

Between CL = 283 and 309 ms the system predicts alternans: the response to the stimulus alternates between two APDs (long, short, long, short, etc.). Sometimes this is called a 2:2 response. Alternans are occasionally seen in the heart, and are usually a sign of trouble.

From CL = 154 to 282 ms the response is 2:1, meaning that after a first stimulus excites an action potential the second stimulus occurs during the refractory period and therefore has no effect. The third stimulus excites another action potential with the same duration as the first (once the transients die away). This is a type of period doubling; the stimulus has period CL but the response has period 2CL. In cardiac electrophysiology, this behavior resembles second-degree heart block.

For a CL of 153 ms or shorter, the system is chaotic. I didn’t explore the diagram in enough detail to tell if self-similar regions of steady-state behavior exist within the chaotic region, as occurs for the logistic map (see Fig. 10.27 in IPMB).

A bifurcation diagram is a useful way to summarize the behavior of a nonlinear system, and provides insight into deadly heart arrhythmias such as ventricular fibrillation.

Friday, May 7, 2021

Servoanalysis of Carotid Sinus Reflex Effects on Peripheral Resistance

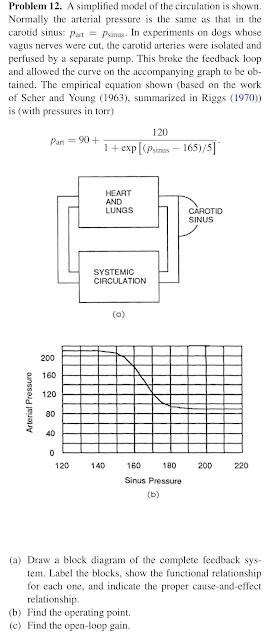
In Chapter 10 of Intermediate Physics for Medicine and Biology, Russ Hobbie and I discuss feedback and control. Homework Problem 12 analyzes the feedback circuit that controls blood pressure.

Problem 12 from Chapter 10 of Intermediate Physics for Medicine and Biology.

The reference to the article by Allen Scher and Allan Young is

Scher AM, Young AC (1963) “Servoanalysis of Carotid Sinus Reflex Effects on Peripheral Resistance,” Circulation Research, Volume 12, Pages 152–165.
I downloaded this paper to learn more about their experiment. Below are excerpts from their introduction.
The baroceptors of the carotid sinus (and artery) and the aortic arch are the major sense organs which reflexly control the systemic blood pressure. Since the demonstration of the reflex function of these receptors… there has been much work on the responses of the blood pressure, heart, and peripheral vessels to changes in pressure in the carotid arteries and the aorta…. In our study, we subjected the isolated perfused carotid sinus to maintained pressures at different levels… and measured the resultant systemic pressures and pressure changes.
Two variables were measured: the systemic pressure (Russ and I call this the arterial pressure, part, in the homework problem) and the pressure in the carotid sinus (psinus). Let’s consider them one at a time.

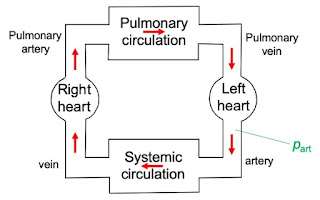
Below I have drawn a schematic diagram of the circulatory system, consisting of the pulmonary circulation (blood flow through the lungs, pumped by the right side of the heart) and the systemic circulation (blood flow to the various organs such as the liver, kidneys, and brain, pumped by the left side of the heart). Scher and Young measured the arterial pressure in the systemic circulation. Most of the pressure drop occurs in the arterioles, capillaries, and venules, so you can measure the arterial pressure in any large artery (such a the femoral artery in the leg) and it is nearly equal to the pressure produced by the left side of the heart. Arterial pressure is pulsatile, but Scher and Young used blood reservoirs to even out the variation in pressure throughout the cardiac cycle, providing a mean pressure. 

A schematic diagram of the circulatory system.
The circulatory system.

My second drawing shows the carotid sinus, a region near the base of the carotid artery (the artery that feeds the brain) that contains baroceptors (nowadays commonly called baroreceptors; pressure sensors that send information about the arterial pressure to the brain so it can maintain the proper blood pressure). Scher and Young isolated the carotid sinus. They didn’t remove it completely from the animal—after all, they still needed to supply blood to the brain to keep it alive—but it was effectively removed from the circulatory system. In the drawing below I show it as being separate from the body. However, the nerves connecting the baroreceptors to the brain remain intact, so changes in the carotid sinus pressure still signal the brain to do whatever’s necessary to adjust the systemic pressure.

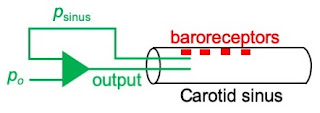
The carotid sinus was attached to a feedback circuit, similar to the voltage clamp used by Hodgkin and Huxley to study the electrical behavior of a nerve axon (see Sec. 6.13 of IPMB). I drew the feedback circuit as an operational amplifier (the green triangle), but this is metaphor for the real instrument. An operational amplifier will produce whatever output is required to keep the two inputs equal. In an electrical circuit, the output would be current and the inputs would be voltage. In Scher and Young’s experiment, the output was flow and the inputs were pressure. Specifically, one of the inputs was the pressure measured in the carotid sinus, and the other was a user-specified constant pressure (po in the drawing). The feedback circuit set psinus = po, allowing the sinus pressure to be specified by the experimenter.
A schematic diagram to represent the feedback circuit that controlled the sinus pressure.
 
Once this elaborate instrumentation was perfected, the experiment itself was simple: Adjust psinus to whatever value you want by varying po, wait several seconds for the system to come to a new equilibrium (so psinus and part have adjusted to a new constant value), and then measure part. Scher and Young obtained a plot of part versus psinus, similar to that given in our homework problem.

As always, details affect the results.
  • Any contribution from pressure sensors in the aortic arch was eliminated by cutting the vagus nerve. Only baroreceptors in the carotid sinus contributed to controlling blood pressure.
  • Scher and Young performed experiments on both dogs and cats. The data in Homework Problem 12 is from a cat.
  • The blood reservoirs acted like capacitors in an electrical circuit, smoothing changes with time.
  • In some experiments, a dog was given a large enough dose of anesthetic that the nerves sending information from the sinus baroreceptors to the brain were blocked. In other experiments, the nerve from the baroreceptors to the brain was cut. In both cases, the change in part with psinus disappeared.
  • Many of Scher and Young’s experiments examined how the feedback circuit varied with time in response to either a step change or a sinusoidal variation in psinus. All of these experiments were ignored in the homework problem, which considers steady state. 
  • Often my students are confused by Problem 12. They think there is only one equation relating part and psinus, but to solve a feedback problem they need two. To resolve this conundrum, realize that when the carotid sinus is not isolated but instead is just one of many large arteries in the body, its pressure is simply the arterial pressure and the second equation is psinus = part.
  • The study provided hints about how the brain adjusted arterial pressure—by changing heart rate, stroke volume, or systemic resistance—but didn’t resolve this issue. 
  • The experiments were performed at the University of Washington School of Medicine in Seattle
  • Allen Scher was a World War II veteran, serving as a Marine in the Pacific. He contributed to our understanding of the electrocardiogram, and was a coauthor on the Textbook of Physiology, cited often as “Patton et al. 1989” in IPMB.
  • Scher was born on April 17, 1921 and died May 12, 2011 at the age of ninety. Recently we celebrated the the hundred-year anniversary of his birth. Happy birthday, Dr. Scher!

Friday, April 30, 2021

A Dozen Electrocardiograms Everyone Should Know

In Chapter 7 of Intermediate Physics for Medicine and Biology, Russ Hobbie and I discuss the electrocardiogram. Today, I present twelve ECGs that everyone should know. I’ve drawn them in a stylized and schematic way, ignoring differences between individuals, changes from beat to beat, and noise.

When I taught medical physics at Oakland University, my lecture on ECGs was preceded by a lesson on cardiac anatomy. If some anatomical terms in this post are unfamiliar, I suggest reviewing the Texas Heart Institute website.

1. Normal Heartbeat

The electrocardiogram (ECG).

Electrocardiograms are plotted on graph paper that consists of large squares, each divided into a five-by-five grid of small squares. The horizontal axis is time and the vertical axis is voltage. Each large square (or box) corresponds to a fifth of a second and a half of a millivolt.

The normal ECG contains three deflections: a small P wave associated with depolarization of the atria, a large narrow QRS complex associated with depolarization of the ventricles, and a T wave associated with repolarization of the ventricles.

A normal heart rate ranges from 60 to 100 beats per minute. The ECG below repeats every four boxes, so the time between beats is 0.8 seconds or 0.0133 minutes, which is equivalent to a heart rate of 75 beats per minute. 

An ECG of a normal heartbeat.
Normal heartbeat.

2. Sinus Bradycardia

A sinus bradycardia is a slow heart beat (slower than 60 beats per minute, or five boxes). The term sinus means the sinoatrial node is causing the slow rate. This node in the right atrium is the heart’s natural pacemaker. Other than its slow rate, the ECG looks normal. A sinus bradycardia may need to be treated by drugs or an implantable pacemaker, or it may represent the healthy heartbeat of a trained athlete who pumps a large amount of blood with each beat. 

An ECG of a sinus bradycardia.
Sinus bradycardia.

3. Sinus Tachycardia

A sinus tachycardia is the opposite of a sinus bradycardia. It’s a fast heart beat (faster than 100 beats per minute, or three boxes). The rapid rate arises because the sinoatrial node paces the heart too quickly. A sinus tachycardia may trigger other more severe arrhythmias we discuss later.

An ECG of a sinus tachycardia.
Sinus tachycardia.

4. Atrial Flutter

During atrial flutter a reentrant circuit exists in the atria. That is, a wave front propagates in a loop, constantly chasing its tail. The nearly sinusoidal, small-magnitude signal in the ECG originates in the atria. Every few rotations around the circuit, the wave front passes through the atrioventricular node—the only connection between the atria and the ventricles—giving rise to a normal-looking QRS complex (the T wave is buried in the atrial signal).

An ECG of atrial flutter.
Atrial flutter.

5. Atrial Fibrillation

Atrial fibrillation is similar to atrial flutter, except the wave fronts in the atrium are not as well organized, propagating in complicated, chaotic patterns resembling turbulence. The part of the ECG arising from the atria looks like noise. Occasionally the wave front passes through the atrioventricular node and produces a normal QRS complex. During atrial fibrillation the ventricles do not fill with blood effectively because the atria and ventricles are not properly synchronized.

An ECG of atrial fibrillation.
Atrial fibrillation.

6. First-Degree Atrioventricular Block

In first-degree atrioventricular block, the time between the end of the P wave and the start of the QRS complex is longer than it should be. Otherwise, the ECG appears normal. This rarely results in a problem for the patient, but does imply that the atrioventricular node is not healthy and trouble with it may develop in the future.

An ECG of first-degree atrioventricular block.
First-degree atrioventricular block.

7. Second-Degree Atrioventricular Block

In second-degree atrioventricular block, the P waves appear like clockwork. The signal often passes through the atrioventricular node to the ventricles, but occasionally it does not. Different types of second-degree block exist. Sometimes the delay between the P wave and the QRS complex gets progressively longer with each beat until propagation through the atrioventricular node fails. Other times, the node will periodically drop a beat; for example if every second beat fails you have 2:1 AV block. Still other times, the node fails sporadically. 

An ECG of second-degree atrioventricular block.
Second-degree atrioventricular block.

8. Third-Degree Atrioventricular Block

If your atrioventricular node stops working entirely, you have third-degree atrioventricular block (also known as complete heart block). A ventricular beat exists because some other part of the conduction system (say, the Bundle of His or the Purkinje fibers) serves as the pacemaker. In this case, the P wave and QRS complex are unsynchronized, like two metronomes set to different rates. In complete heart block, the ventricles typically fire at a slow rate. Sometimes a patient will intermittently go in and out of third-degree block, causing fainting spells.

An ECG of third-degree atrioventricular block.
Third-degree atrioventricular block.

9. Premature Ventricular Contraction

Sometimes the heart will beat with a normal ECG, and than sporadically have an extra ventricular beat: a premature ventricular contraction. Usually these beats originate within the ventricle, so they are not distributed through the cardiac conduction system and therefore produce a wide, bizzare QRS complex. As long as these premature contractions are rare they are not too dangerous, but they risk triggering more severe ventricular arrhythmias.

An ECG of premature ventricular contraction.
Premature ventricular contraction.

10. Ventricular Tachycardia

A ventricular tachycardia is a rapid heartbeat arising from a reentrant circuit in the ventricles. The ECG looks like a series of premature ventricular contractions following one after another. The VT signal typically has a large amplitude, and the atrial signal is often too small to be seen. This is a serious arrhythmia, because at such a fast rate the heart doesn’t pump blood effectively. It’s not lethal itself, but can become deadly if it decays into ventricular fibrillation.

An ECG of ventricular tachycardia.
Ventricular tachycardia.

11. Ventricular Fibrillation

In ventricular fibrillation, different parts of the ventricles contract out of sync, resulting in the heart quivering rather than beating. A heart in VF does not pump blood, and the patient will die in ten to fifteen minutes unless defibrillated by a strong electric shock. Ventricular fibrillation is the most common cause of sudden cardiac death.

An ECG of ventricular fibrillation.
Ventricular fibrillation.

12. Asystole

In asystole, the heart has no electrical activity, so the ECG is a flat line. Asystole is the end stage of ventricular fibrillation, when the chaotic electrical activity dies away and nothing remains.

An ECG of asystole.
Asystole.


Once you master these twelve ECGs, you’ll be on your way to understanding the electrical behavior of the heart. If you want to learn more, I suggest trying the SkillStat six-second ECG game, which includes 27 ECGs. It’s fun.

Friday, April 23, 2021

Electric and Magnetic Fields From Two-Dimensional Anisotropic Bisyncytia


Page 223 of Intermediate Physics for Medicine and Biology.

Figure 8.18 on page 223 of Intermediate Physics for Medicine and Biology contains a plot of the magnetic field produced by action currents in a slice of cardiac tissue. The measured magnetic field contours have approximately a four-fold symmetry. The experiment by Staton et al. that produced this data was a tour de force, demonstrating the power of high-spatial-resolution biomagnetic techniques. 
 
Sepulveda NG, Wikswo JP (1987) “Electric and Magnetic Fields From Two-Dimensional Anisotropic Bisyncytia,” Biophysical Journal, Volume 51, Pages 557-568, superimposed on Intermediate Physics for Medicine and Biology.
Sepulveda and Wikswo (1987).
In this post, I discuss the theoretical prediction by Nestor Sepulveda and John Wikswo in the mid 1980s that preceded and motivated the experiment.
Sepulveda NG, Wikswo JP (1987) “Electric and Magnetic Fields From Two-Dimensional Anisotropic Bisyncytia,” Biophysical Journal, Volume 51, Pages 557-568.
Their abstract is presented below.
Cardiac tissue can be considered macroscopically as a bidomain, anisotropic conductor in which simple depolarization wavefronts produce complex current distributions. Since such distributions may be difficult to measure using electrical techniques, we have developed a mathematical model to determine the feasibility of magnetic localization of these currents. By applying the finite element method to an idealized two-dimensional bisyncytium [a synonym for bidomain] with anisotropic conductivities, we have calculated the intracellular and extracellular potentials, the current distributions, and the magnetic fields for a circular depolarization wavefront. The calculated magnetic field 1 mm from the tissue is well within the sensitivity of a SQUID magnetometer. Our results show that complex bisyncytial current patterns can be studied magnetically, and these studies should provide valuable insight regarding the electrical anisotropy of cardiac tissue.
Sepulveda and Wikswo assumed the tissue was excited by a brief stimulus through an electrode (purple dot in the illustration below), resulting in a circular wave front propagating outward. The transmembrane potential coutours at one instant are shown in red. The assumption of a circular wave front is odd, because cardiac tissue is anisotropic. A better assumption would have been an elliptical wave front with its long axis parallel to the fibers. Nevertheless, the circular wave front captures the essential features of the problem.

If the tissue were isotropic, the intracellular current density would point radially outward and the extracellular current density would point radially inward. The intracellular and extracellular currents would exactly cancel, so the net current (their sum) would be zero. Moreover, the net current would vanish if the tissue were anisotropic but had equal anisotropy ratios. That is, if the ratios of the electrical conducivities parallel and perpendicular to the fibers were the same in the intracellular and extracellular spaces. The only way to produce a net current (shown as the blue loops in the illustration below) is if the tissue has unequal anisotropy ratios. In that case, the loops are four-fold symmetric, rotating clockwise in two quadrants and counterclockwise in the other two.

Current loops produce magnetic fields. The right-hand-rule implies that the magnetic field points up out of the plane in the top-right and the bottom-left quadrants, and down into the plane in the other two. The contours of magnetic field are green in the illustration below, and the peak magnitude for a 1 mm thick sheet of is about one fourth of a nanotesla.

Jut for fun, I superimposed the transmembrane potential, net current density, and magnetic field plots in the picture below.

Notes:
  1. The measurement of the magnetic field is a null detector of unequal anisotropy ratios. In other words, in tissue with equal anisotropy ratios the magnetic field vanishes, so the mere existence of a magnetic field implies the anisotropy ratios are unequal. The condition of unequal anisotropy ratios has many implications for cardiac tissue. One is discussed in Homework Problem 50 in Chapter 7 of IPMB
  2. If the sheet of cardiac tissue is superfused by a saline bath, the magnetic field distribution changes.
  3. Wikswo was a pioneer in the field of biomagnetism. In particular, he developed small scanning magnetometers that had sub-millimeter spatial resolution. He was in a unique position of being able to measure the magnetic fields that he and Sepulveda predicted, which led to the figure included in IPMB
  4. I was a graduate student in Wikswo’s laboratory when Sepulveda and Wikswo wrote this article. Sepulveda, a delightful Columbian biomedical engineer and a good friend of mine, worked as a research scientist in Wikswo’s lab. He was an expert on the finite element method—the numerical technique used in his paper with Wikswo—and had written his own finite element code that no one else in the lab understood. He died a decade ago, and I miss him. 
  5. Sepulveda and Wikswo were building on a calculation published in 1984 by Robert Plonsey and Roger Barr (“Current Flow Patterns in Two Dimensional Anisotropic Bisyncytia With Normal and Extreme Conductivities,” Biophys. J., 45:557-571). Wikswo heard either Plonsey or Barr give a talk about their results at a scientific meeting. He realized immediately that their predicted current loops implied a biomagnetic field. When Wikswo returned to the lab, he described Plonsey and Barr’s current loops at a group meeting. As I listened, I remember thinking “Wikswo’s gone mad,” but he was right.
  6. Two years after their magnetic field article, Sepulveda and Wikswo (now with me included as a coauthor) calculated the transmembrane potential produced when cardiac tissue is stimulated by a point electrode. But that’s another story.
I’ll give Sepulveda and Wikswo the last word. Below is the concluding paragraph of their article, which looks forward to the experimental measurement of the magnetic field pattern that was shown in IPMB.
The bidomain model of cardiac tissue provides a tool that can be explored and used to study and explain features of cardiac conduction. However, it should be remembered that “a model is valid when it measures what it is intended to measure” (31). Thus, experimental data must be used to evaluate the validity of the bidomain model. This evaluation must involve comparison of the model's predictions not only with measured intracellular and extracellular potentials but also with the measured magnetic fields. When the applicability of the bidomain model to a particular cardiac preparation and the validity and reliability of our calculations have been determined experimentally, this mathematical approach should then provide a new technique for analyzing normal and pathological cardiac activation.
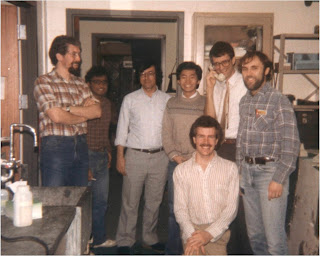
Members of John Wikswo's laboratory at Vanderbilt University in the mid 1980s.
Members of Wikswo's lab at Vanderbilt University in the mid 1980s: John Wikswo is on the phone, Nestor Sepulveda is in the white shirt and gray pants, and I am on the far right. The other people are Frans Gielen (the tall guy with arms crossed on the left), Ranjith Wijesinghe (between Gielen and Sepulveda), Peng Zhang (between Wikswo and Sepulveda), and Pat Henry (knelling).