Wednesday, April 8, 2020

The Localization of Sound

In Chapter 13 of Intermediate Physics for Medicine and Biology, Russ Hobbie and I include a homework problem about the localization of sound.
Problem 20. People use many cues to estimate the direction a sound came from. One is the time delay between sound arriving at the left and right ears. Estimate the maximum time delay. Ignore any diffraction effects caused by the head.
Air and Water, by Mark Denny, superimposed on Intermediate Physics for Medicine and Biology.
Air and Water,
by Mark Denny.
What other ways do people use to sense the direction to the source of a sound? In Air and Water, Mark Denny discusses four.

Sense the Direction that Fluid Moves in a Sound Wave

Some animals can sense the direction that fluid moves in a sounds wave. This requires an ear that responds to motion (a vector) instead of pressure (a scalar). Apparently this ability is common in fish, but not in terrestrial animals.

Comparing the Intensity at Each Ear

Most animals have two ears. If one is closer to the source of a sound than the other, it hears a louder sound. Also, the presence of the body may attenuate or diffract the sound that reaches the far ear, changing its intensity. Denny notes two problems with this mechanism. First, attenuation in air occurs over large distances (70 dB per kilometer), so we would not expect much difference of intensity because the ears are, say, 20 cm apart. Second, the perceived direction is ambiguous. The sound from a source in front of us produces the same intensity at each ear, but so does sound from a source behind us. One way to resolve the ambiguity is to tilt your head as you listen, providing two data point: before and after the tilt.

Comparing the Delay at Each Ear

The homework problem Russ and I wrote is based on the time difference of sound arriving at each ear. This mechanism shares the problem mentioned earlier of direction ambiguity. The biggest problem, however, is that the arrival time at each ear differs by only a small amount: less than a millisecond. Nevertheless, bats appear to make use of this mechanism. For smaller animals (such as hummingbirds) the delays may be too short to be perceptible. Moreover, the speed of sound in water is more than four times the speed of sound in air, so this mechanism is unreliable for aquatic animals. SCUBA divers have trouble localizing sound.

Detecting the Phase Shift Between Each Ear

This mechanism is similar to comparing arrival times, except instead of sensing the delay you sense the phase difference. The method suffers from the same ambiguities discussed earlier, plus another unique to the detection of phase. If the phase shifts by an entire wavelength, it sounds the same as if it had no phase shift at all. So, you don’t want large phase shifts (greater than 2π), but you don’t want small phase shifts that are lost in the noise. Some small animals (such as crickets) have their ears connected by an air-filled tube, so they only detect sound when the two ears are out of phase. Because the speed of sound changes with temperature, any mechanism based on the speed of sound might function differently on a cold day than on a hot one.

Denny concludes
Despite the inherent problems of determining direction, animals combine the methods described above and thereby perform admirably. For example, bats and owls have been shown to localize sounds with 1° to 2°, and dolphins have similar directional acuity. Humans, cats, and opossums can localize sounds within 1° to 6° (Lewis 1983). These abilities are a tribute to the ability of the nervous system to assimilate complex data.
I don’t mind being beaten out by a cat, but we humans need to up our game if we want to do better than those possums.
Tuesday, April 7, 2020

Time-Dependent Solutions to Fick’s Equations

Solving the diffusion equation (also known as Fick’s second law) can require fancy mathematics. After discussing a few solutions in Intermediate Physics for Medicine and Biology, Russ Hobbie and I write
Many other solutions to the diffusion equation and techniques for solving it are known. See Crank (1975) and Carslaw and Jaeger (1959).
Random Walks in Biology, by Howard Berg, superimposed on Intermediate Physics for Medicine and BIology.
Random Walks in Biology,
by Howard Berg.
In Random Walks in Biology, Howard Berg addresses the same point.
Time-dependent solutions to Fick’s equations

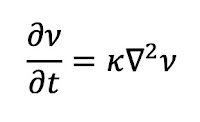
One way to find solutions to Fick’s equations is to look them up! An excellent source is Carslaw and Jaeger (1959), a book dealing with the conduction of heat in solids. The heat equation has the same form as the diffusion equation [see Chapter 4, Homework Problem 19 in IPMB]. In the notation of Carslaw and Jaeger,
The heat equation.
where ν is the temperature and κ is the thermal diffusivity. So, take their results and read C for ν and D for κ. Sources that do not require such translation include Crank (1975) and Jost (1960). But this strategy requires luck. If you happen to find a discussion of just the problem that you are trying to solve, well and good. If not, you will soon be lost in a morass of complex equations.
After reading this, my first thought was: I know Crank, and I know Carslaw and Jaeger, but who’s Jost? The reference is to
Jost, W. 1960. Diffusion in Solids, Liquids, Gases. Academic.
The Oakland University library does not own this book, but even if it did the book might as well be on the moon for all the access I have to it. I can still download journal articles through the library website, but the library building itself is locked up tight because of the coronavirus.

If Jost’s book is anything like Crank’s or Carslaw and Jaeger’s, it’s overflowing with mathematics (just the way I like it).

I was able to find an obituary for Wilhelm Jost, written by Hartweil Calcote.
F. Wilhelm Jost
1903-1988
Professor Dr. sc. nat. Dres. h. c. W. Jost died on September 25, 1988 in G6ttingen. W. Jost was a preeminent scientist who pioneered research and development in combustion, reaction-kinetics in gases and solids, diffusion in solids and phase separation. He authored several monographs that have become classics in the field, among them “Explosions- und Verbrennungsvorg/inge in Gasen” with English and Russian editions. Several Academies of Science elected him as a member and he served on the boards of many scientific societies.
W. Jost was a director of the International Combustion Institute for decades and he founded and directed its German section. His many distinguished awards include the Institute's Sir Alfred Egerton Gold Medal.
F. W. Jost was born in Friedberg in Hessen. He studied chemistry in Halle and Munich and received his Dr. sc. nat. degree in chemistry from the University of Halle in 1926. He then joined M. Bodenstein in Berlin where his work on gas kinetics and hydrocarbon oxidation started. In 1929 Jost became Privatdozent in Hannover. From 1932 to 1933 he spent a year at MIT in Cambridge, Massachusetts, where he founded the basis for the understanding of disorder energies. In 1937 W. lost became a Professor of Physical Chemistry in Leipzig, in 1943 at the University of Marburg and 1951 in Darmstadt, in 1952 he accepted a call to the chair of W. Nernst at the University in G6ttingen.
On the occasion of the honorary promotion in Cambridge it was stated: "This man has always shown himself zealous for liberty, careful of truth and thoroughly civilized".
The members of the International Combustion Institute express their deep sympathy to his wife and his family.
Solving a differential equation by looking the solution up is an odd way to do math, but for the diffusion equation it often works. I will add Jost’s book to my list of post-pandemic reading.

Monday, April 6, 2020

Visualizing the Gaussian Distribution

In Chapter 4 of Intermediate Physics for Medicine and Biology, Russ Hobbie and I include a homework problem about the Péclet number.
Section 4.12

Problem 43. Dimensionless numbers, like the Reynolds number of Chap. 1, are often useful for understanding physical phenomena. The Péclet number is the ratio of transport by drift to transport by diffusion. When the Péclet number is large, drift dominates. The solute fluence rate from drift is Cv, where C is the concentration and v the solvent speed. The solute fluence rate from diffusion is D times the concentration gradient (roughly C/L, where L is some characteristic distance over which the concentration varies).

(a) Determine an expression for the Péclet number in terms of C, L, v, and D.

(b) Verify that the Péclet number is dimensionless.

(c) Which parameter in Sect. 4.12 is equivalent to the Péclet number?

(d) Estimate the Péclet number for oxygen for a person walking.

(e) Estimate the Péclet number for a swimming bacterium. For more about the Péclet number, see Denny (1993) and Purcell (1977).

The Péclet number is sometimes known as the Sherwood number.
Random Walks in Biology, by Howard Berg, superimposed on Intermediate Physics for Medicine and Biology.
Random Walks in Biology,
by Howard Berg.
At the macroscopic level the Péclet number is often large: drift dominates over diffusion. To get an intuitive understanding of how difficult it is to visualize diffusion at the macroscopic scale, consider what Howard Berg says in this excerpt from Random Walks in Biology.
Visualizing the Gaussian distribution: It is instructive to generate the [Gaussian] distributions shown in Fig. 1.3 experimentally [Berg’s Fig. 1.3 is similar to Fig. 4.13 in IPMB]. This can be done by layering aqueous solutions of a dye, such as fluorescein or methylene blue, into water. For a first try, layer the dye at the center of a vertical column of water in a graduated cylinder. The dye promptly sinks to the bottom! It does so because it has a higher specific gravity than the surrounding medium [See Sec. 1.13 in IPMB]. For a second try, match the specific gravity of the medium to the dye by adding sucrose [sugar] to the water. Now the dye drifts about and becomes uniformly dispersed in a matter of minutes or hours. It does so because there is nothing to stabilize the system against convective flow [flow of the liquid caused by density variations]. Any variation in temperature that increases the specific gravity of regions of the fluid that are higher in the column relative to those that are lower drives this flow [that is, if the bottom gets hot, the liquid there becomes less dense and rises, while the more dense liquid at the top sinks]. For a final try, layer the dye into a column of water containing more sucrose at the bottom than at the top, i.e., into a sucrose density gradient; a 0-to-2% w/v [weight per volume] solution will do. Match the specific gravity of the solution of the dye to that at the midpoint of the gradient and layer it there. Now, patterns for the sort shown in Fig. 1.3 [a Gaussian distribution] will evolve over a period of many days. The diffusion coefficients of fluorescein, methylene blue, and sucrose are all about 5 × 10⁻⁶ cm2/sec [5 × 10⁻¹⁰ m2/sec, consistent with Fig, 4.11 in IPMB]. A sucrose gradient x = 10 cm high will survive for a period of time of order t = x2/2D = 107 sec, or about 4 months [I am surprised it would last that long]. The dye will generate a Gaussian distribution with a standard deviation σx = 2.5 cm in a time t = σx2/2D = 6 × 10⁵ sec, or in about 1 week. Try it!
I get the impression he did try it. Berg continues
It is evident from this experiment that diffusive transport takes a long time when distances are large. Here is another example: The diffusion coefficient of a small molecule in air is about 10-1 cm2/sec. If one relied on diffusion to carry molecules of perfume across a crowded room, delays of the order of 1 month would be required. Evidently, the makers of scent owe their livelihood to close encounters [😉], wind, and/or convective flow.
Diffusion is an effective mechanism to transport molecules over short distances, but it works poorly over long distances. The intuition we develop in our everyday life can sometimes mislead us when we think about small-scale biological processes. We generally live in a large Péclet number world. Cells, bacteria, viruses, membranes, and proteins operate at small Péclet number, where diffusion dominates. We can’t trust our intuition when discussing life at low Péclet number.

Friday, April 3, 2020

Diffusion From a Micropipette

In Chapter 4 of Intermediate Physics for Medicine and Biology, Russ Hobbie and I solve the diffusion equation. We consider the classic one-dimensional example of particles released at a point (x = 0) and at one instant (t = 0). The particles diffuse, and the concentration C(x,t) has a Gaussian distribution

An equation for the concentration as a function of position and time during diffusion.

where D is the diffusion constant and N is the number of particles per unit area (assuming diffusion along a tube of fixed cross-sectional area).

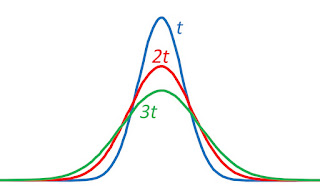
Often this concentration distribution is drawn as a function of x at a fixed time t (a snapshot). Russ and I include such an illustration in IPMB’s Figure 4.13. Below is a modified version of that figure, showing the Gaussian distribution at three times.
The concentration C(x,t) as a function of x at three times t, 2t, and 3t.
Alternatively, we could plot the concentration as a function of t, for a particular location x. Such a plot illustrates how a wave of particles diffuses outward, so at any point x the concentration starts at zero, rises quickly to a peak, and then slowly decays.

The concentration C(x,t) as a function of t at three locations x, 2x, and 3x.
We can calculate the time when the concentration reaches its peak, tpeak, by setting the time derivative of C(x,t) equal to zero and solving for t. The result is tpeak = x2/2D. To find the maximum value of the concentration, Cmax, at any location we plug tpeak into the expression for C(x,t) and find Cmax = 0.242N/x.

Random Walks in Biology, by Howard Berg, superimposed on Intermediate Physics for Medicine and Biologyl.
Random Walks in Biology,
by Howard Berg.
I was motivated to draw the concentration as a function of time by the discussion of diffusion in Howard Berg’s book Random Walks in Biology. He also analyzes the three-dimensional version of this problem. 
Diffusion from a micropipette: A micropipette filled with an aqueous solution of a green fluorescent dye is inserted into a large body of water. At time t = 0, particles of the dye are injected into the water… The total number of particles injected is N… [The diffusion equation] has the solution
An equation for the concentration as a function of position and time during diffusion.
This is a three-dimensional Gaussian distribution… Looking through a microscope, one sees the sudden appearance of a green spot that spreads rapidly outward and fades away. The concentration remains highest at the tip of the pipette, but it decreases there as the three-halves power of time.
I’ll let the reader analyze this case by writing a new homework problem. Enjoy!
Section 4.8

Problem 16 ½. When N particles released at time t = 0 and location r = 0 diffuse, the concentration C(r,t) is governed by
An equation for the concentration as a function of position and time during diffusion.
(a) Show that this expression for C(r,t) obeys the diffusion equation written in spherical coordinates
The diffusion equation in spherical coordinates.
(b) Integrate C(r,t) over all space and show that the number of particles is always N.

(c) Calculate the variance (the mean value of r2) and show that σ2 = 6Dt, as found in Problem 16. You may need an integral from Appendix K.
(d) Calculate the time tpeak when the concentration at a distance r is maximum.

(e) Calculate the maximum concentration, Cmax, at distance r.
(f) Sketch a plot of C(r,t) as a function of r for three times, and then plot C(r,t) as a function of t for three locations.

Thursday, April 2, 2020

Ten Groups Exposed to Radiation

Medical Imaging Physics, by Hendee and Ritenour, superimposed on Intermediate Physics for Medicine and Biology.
Medical Imaging Physics,
by Hendee and Ritenour.
In Medical Imaging Physics, William Hendee and E. Russell Ritenour list ten populations that have been exposed to high levels of ionizing radiation.

Atom Bomb Survivors

At the end of World War II, several hundred thousand Japanese were exposed to large doses of ionizing radiation caused by the dropping of atomic bombs. They have been studied carefully, and provide much of our data about the risk of radiation exposure.

Early Radiologists, Nurses, and Technologists

Medical personnel who worked with early and primitive radiation equipment were exposed to relatively large doses of radiation. They suffered from an increased risk for some cancers, such as leukemia. You can include in this category scientists like Marie Curie, who may have died from radiation encountered during her research.

Uranium and Other Miners

In Intermediate Physics for Medicine and Biology, Russ Hobbie and I discuss Bernard Cohen’s studies of lung cancer risk in uranium miners. They suffer from a toxic mix of radon gas, dust, and tobacco smoke.

Radium Dial Painters

These unfortunate workers (mostly women) applied radioactive paint to illuminate dials. Their sad story is told by Kate Moore in her book The Radium Girls. We could lump the kids exposed to shoe fitting fluoroscopy into this group.

Radiation Therapy Patients

When radiation is used to treat patients with cancer, some of their normal tissue is exposed to high doses. Getting good data about the risk of cancer for such patients is difficult; they already have cancer, which affects the chance of it reoccurring. Hendee and Ritenour point out that in the past some benign disorders have been treated with radiation (for example, ringworm). These patients tended to have an elevated incidence of cancer.

Diagnostic Radiology Patients

Today radiation exposure for most diagnostic imaging is very low, but it has not always been so. Fluoroscopy in the 1940s could give patients a dose of a few grays. These patients provide data about the risk of radiation, although confounding factors make it hard to interpret.

Nuclear Weapons Tests

In the 1950s, many nuclear bombs were tested in the atmosphere over the Pacific Ocean. In particular, Marshall Islanders were exposed to 131I in fallout, leading to thyroid cancer.

Regions with High Natural Background

Several locations have unusually high background radiation levels: Guarapari, Brazil; the Kerala Coast of India; and the Guangdong Province in China. Hendee and Ritenour tell a funny story about the Monazite sand formations in Guarapari. Local inhabitants, who were mostly Catholics, were given hollow medals of the Virgin Mary filled with thermoluminescent dosimetry powder. After three months the powder was analyzed to determine their dose. Hendee and Ritenour add helpfully “the subjects were allowed to keep the medals.”

Air and Space Travel

Cosmic ray exposure increases with altitude and latitude. Hendee and Ritenour state “a flight in a typical commercial airliner results in an equivalent dose rate of approximately 0.005 to 0.01 mSv/hr.” The risk is largest for those who spend a long time in the air (e.g., pilots). Astronauts in low-earth orbit typically receive about 1 mSv per day.  I fear the astronauts on a mission to Mars will provide too much data about the risk of radiation.

Nuclear Accidents

The Chernobyl nuclear accident “resulted in whole-body doses exceeding 1 Gy… to over 200 workers.” Millions of residents of Ukraine, Belarus, and Russia had elevated exposure. Since Medical Imaging Physics was written, the Fukushima disaster has provided additional data on the risk of radiation to humans.


These ten groups have one thing in common: they didn’t want to be subjects of an experiment. In many cases, the exposure was inadvertent or accidental. In other cases—such as for the radium girls—the exposure was criminal. Much of our knowledge about radiation hazards comes from these unwitting victims. It’s data we love to have, but hate to get. 

Wednesday, April 1, 2020

William Harvey’s On the Movement of the Heart and Blood in Animals

A Classic Club book, superimposed on Intermediate Physics for Medicine and Biology.
A Classics Club book
When I was a teenager, I belonged to the Classics Club. Each month I was sent a box containing a couple books, which I’d either purchase or return. Most of these were classics of the Western canon. Some of my favorites were Homer’s Iliad, Plutarch’s Lives, Meditations by Marcus Aurelius, A Tale of Two Cities by Charles Dickens, The Autobiography of Benjamin Franklin, and Selected Tales and Poems by Edgar Allan Poe.

The Beginnings of Modern Science, edited by Holmes Boynton, superimposed on Intermediate Physics for Medicine and Biology.
The Beginnings of Modern Science,
Edited by Holmes Boynton.
One of the books I bought was The Beginnings of Modern Science: Scientific Writings of the 16th, 17th and 18th Centuries, edited by Holmes Boynton. Does this collection contain any biological or medical physics? Yes! The best example is an excerpt from William Harvey’s book On the Movement of the Heart and Blood in Animals (1628). The book was originally written in Latin, and the Classics Club edition was translated into English by R. Willis.
That there is a Circulation of the Blood is confirmed from the first proposition
But lest anyone should say that we give them words only, and make mere specious assertions without any foundation, and desire to innovate without sufficient cause, three points present themselves for confirmation, which being stated, I conceive that the truth I contend for will follow necessarily, and appear as a thing obvious to all.

First, the blood is incessantly transmitted by the action of the heart from the vena cava to the arteries in such quantity that it cannot be supplied from ingesta, and in such a manner that the whole must very quickly pass through the organ.

Second, the blood under the influence of the arterial pulse enters and is impelled in a continuous, equable, and incessant stream through every part and member of the body, in much larger quantity than were sufficient for nutrition, or than the whole mass of fluids could supply.

Third, the veins in like manner return this blood incessantly to the heart from parts and members of the body.

These points proved, I conceive it will be manifest that the blood circulates, revolves, propelled and then returning, from the heart to the extremities, from the extremities to the heart, and thus that it performs a kind of circular motion.
Next Harvey does a back-of-the-envelope calculation of how much blood circulates through the body. This estimate sounds as if it could have appeared in Intermediate Physics for Medicine and Biology.
Let us assume, either arbitrarily of from experiment, the quantity of blood which the left ventricle of the heart will contain, when distended, to be, say two ounces, three ounces, or one ounce and a half; in the dead body I have found it to hold upwards of two ounces. Let us assume, further, how much less the heart will hold in the contracted than in the dilated state; and how much blood will project into the aorta upon each contraction;—and all the world allows that with the systole something is always projected, a necessary consequence demonstrated in the third chapter, and obvious from the structure of the valves; and let us suppose, as approaching the truth, that the fourth, or fifth, or sixth, or even but the eighth part of its charge is thrown into the artery at each contraction; this would give either half an ounce, or three drachms, or one drachm of blood as propelled by the heart at each pulse into the aorta; which quantity, by reasons of the valves at the root of the vessel, can by no means return into the ventricle.

Now in the course of half an hour, the heart will have made more than one thousand beats, in some as many as two, three, and even four thousand. Multiplying the number of drachms propelled by the number of pulses, we shall have either one thousand half ounces, or one thousand times three drachms, or a like proportional quantity of blood, according to the amount which we assume as propelled with each stroke of the heart, sent from this organ into the artery; a larger quantity in every case than is contained in the whole body! In the same way, in the sheep or dog, say that but a single scruple of blood passes with each stroke of the heart, in one half hour we should have one thousand scruples, or about three pounds and a half of blood injected into the aorta; but the body of neither animal contains above four pounds of blood, a fact which I have myself ascertained in the case of the sheep.

Upon this supposition, therefore, assumed merely as a ground for reasoning, we see the whole mass of blood passing through the heart, from the veins to the arteries, and in like manner through the lungs.
Asimov's Biographical Encyclopedia
of Science & Technology,
by Isaac Asimov.
More about Harvey’s work can be found in Asimov’s Biographical Encyclopedia of Science & Technology.
HARVEY, William
English physician
Born: Folkestone, Kent, April 1, 1578
Died: London, June 3, 1657

…[Harvey] was more interested in medical research than in routine practice. By 1616, he is supposed to have dissected eighty species of animals. In particular he studied the heart and blood vessels… He determined the heart was a muscle and that it acted by contracting, pushing blood out. Through actual dissection he noted that the valves separating the two upper chambers of the heart (auricles) from the two lower (ventricles) were one-way. Blood could go from auricle to ventricle but not vice versa. There were one-way values in the veins too, these having been discovered by Fabricius. For that reason, blood in the veins could travel only toward the heart and not away from it….

When Harvey tied off an artery it was the side toward the heart that bulged with blood. When he tied off a vein the side away from the heart bulged. Everything combined to indicate that blood did not oscillate back and forth in the vessels as Galen… had believed but traveled in one direction only.

Furthermore Harvey calculated that in one hour the heart pumped out a quantity of blood that was three times the weight of a man. It seemed inconceivable that blood could be formed and broken down again at such a rate. Therefore it had to be the same blood moving in circles, from the heart to the arteries, from these to the veins, from those back to the heart. The blood, in other words, moved in a closed curve. It circulated.
Part of my collection of Classic Club books, next to Intermediate Physics for Medicine and Biology.
Part of my collection of Classics Club books.

Tuesday, March 31, 2020

Art Winfree and Defibrillation

Chaos: Making a New Science, by James Gleick, superimposed on Intermediate Physics for Medicine and Biology.
Chaos: Making a New Science,
by James Gleick.
Yesterday I posted an excerpt from Chaos: Making a New Science. Here’s a dirty little secret: I haven’t read this book yet. I own a copy, and hope to read it soon (if we’re still locked down by the coronavirus once the semester is over, I’ll have plenty of time to read!). I did thumb through it, and found another interesting story. Regular readers of this blog know that the mathematical biologist Art Winfree played a key role in my development as a scientist. In Chaos, James Gleick tells how Winfree teamed up with Duke cardiologist Ray Ideker to study defibrillation.
Winfree told the story of an early researcher, George Mines, who in 1914 was twenty-eight years old. In his laboratory at McGill University in Montreal, Mines made a small device capable of delivering small, precisely regulated electrical impulses to the heart.

“When Mines decided it was time to begin work with human beings, he chose the most readily available experimental subject: himself,” Winfree wrote. “At about six o’clock that evening, a janitor, thinking it was unusually quiet in the laboratory, entered the room. Mines was lying under the laboratory bench surrounded by twisted electrical equipment. A broken mechanism was attached to his chest over the heart and a piece of apparatus nearby was still recording the faltering heartbeat. He died without recovering consciousness.”

One might guess that a small but precisely timed shock can throw the heart into fibrillation, and indeed even Mines had guessed it, shortly before his death. Other shocks can advance or retard the next beat, just as in circadian rhythms. But one difference between hearts and biological clocks, a difference that cannot be set aside even in a simplified model, is that a heart has a shape in space. You can hold it in your hand. You can track an electrical wave through three dimensions.

To do so, however, requires ingenuity. Raymond E. Ideker of Duke University Medical Center read an article by Winfree in Scientific American in 1983 and noted four specific predictions about inducing and halting fibrillation based on nonlinear dynamics and topology. Ideker didn’t really believe them. They seemed too speculative and, from a cardiologist’s point of view, so abstract. Within three years, all four had been tested and confirmed, and Ideker was conducting an advanced program to gather the richer data necessary to develop the dynamical approach to the heart. It was, as Winfree said, “the cardiac equivalent of a cyclotron.”

The traditional electrocardiogram offers only a gross one-dimensional record. During heart surgery a doctor can take an electrode and move it from place to place on the heart, sampling as many as fifty or sixty sites over a ten-minute period and thus producing a sort of composite picture. During fibrillation this technique is useless. The heart changes and quivers far too rapidly. Ideker’s technique, depending heavily on real-time computer processing, was to embed 128 electrodes in a web that he would place over a heart like a sock on a foot. The electrodes recorded the voltage field as each wave traveled through the muscle, and the computer produced a cardiac map.

Ideker’s immediate intention, beyond testing Winfree’s theoretical ideas, was to improve the electrical devices used to halt fibrillation. Emergency medical teams carry standard versions of defibrillators, ready to deliver a strong DC shock across the thorax of a stricken patient. Experimentally, cardiologists have developed a small implantable device to be sewn inside the chest cavity of patients thought to be especially at risk, although identifying such patients remains a challenge. An implantable defibrillator, somewhat bigger than a pacemaker, sits and waits, listening to the steady heartbeat, until it becomes necessary to release a burst of electricity. Ideker began to assemble the physical understanding necessary to make the design of defibrillators less a high-priced guessing game, more a science.
You can learn more about Winfree, nonlinear dynamics, the heart, and defibrillation in Intermediate Physics for Medicine and Biology.

James Gleick on Chaos: Making a New Science.
https://www.youtube.com/watch?v=3orIIcKD8p4

Ray Ideker discusses Mechanisms of
Ventricular Fibrillation and Defibrillation.
https://www.youtube.com/watch?v=94eU2ztM_uU

Monday, March 30, 2020

Chaos: Making a New Science


In Chapter 10 of Intermediate Physics for Medicine and Biology, Russ Hobbie and I include a homework problem about the Lorenz model.
Problem 36. Edward Lorenz (1963) published a simple, three-variable (x, y, z) model of Rayleigh–Bénard convection:

dx/dt = σ (yx)

dy/dt = x (ρz) − y

dz/dt = x yβ z

where σ = 10, ρ = 28, and β = 8/3.

(a) Which terms are nonlinear?

(b) Find the three equilibrium points for this system of equations.

(c) Write a simple program to solve these equations on the computer (see Sect. 6.14 for some guidance on how to solve differential equations numerically). Calculate and plot x(t) as a function of t for different initial conditions. Consider two initial conditions that are very similar, and compute how the solutions diverge as time goes by.

(d) Plot z(t) vs. x(t), with t acting as a parameter of the curve.
This model played a critical role in the history of nonlinear dynamics; it resulted in Lorenz discovering chaos. More specifically, his calculation revealed one of the hallmarks of chaotic behavior: sensitivity to initial conditions, also known as the butterfly effect.

Chaos: Making a New Science, by James Gleick, superimposed on Intermediate Physics for Medicine and Biology.
Chaos: Making a New Science,
by James Gleick.
I will let James Gleick, author of Chaos: Making a New Science, tell the story. Lorenz’s equations are a model for the weather, which he solved using one of the first computers.
One day in the winter of 1961, wanting to examine one sequence at greater length, Lorenz took a shortcut. Instead of starting the whole run over, he started midway through. To give the machine its initial conditions, he typed the numbers straight from the earlier printout. Then he walked down the hall to get away from the noise and drink a cup of coffee. When he returned an hour later, he saw something unexpected, something that planted the seed for a new science.

This new run should have exactly duplicated the old. Lorenz had copied the numbers into the machine himself. The program had not changed. Yet as he stared at the new printout, Lorenz saw his weather diverging so rapidly from the pattern of the last run that, within just a few months, all resemblance had disappeared. He looked at one set of numbers, then back at the other. He might as well have chosen two random weathers out of a hat. His first thought was that another vacuum tube had gone bad.

Suddenly he realized the truth. There had been no malfunction. The problem lay in the numbers he had typed. In the computer’s memory, six decimal places were stored: .506127. On the printout, to save space, just three appeared: .506. Lorenz had entered the shorter, rounded-off numbers, assuming that the difference—one part in a thousand—was inconsequential…

He decided to look more closely at the way two nearly identical runs of weather flowed apart. He copied one of the wavy lines of output onto a transparency and laid it over the other, to inspect the way it diverged. First, two humps matched detail for detail. Then one line began to lag a hairsbreadth behind. By the time the two runs reached the next hump, they were distinctly out of phase. By the third or fourth hump, all similarity had vanished.

It was only a wobble from a clumsy computer. Lorenz could have assumed something was wrong with his particular machine or his particular model—probably should have assumed. It was not as though he had mixed sodium and chlorine and got gold. But for reasons of mathematical intuition that his colleagues would begin to understand only later, Lorenz felt a jolt: something was philosophically out of joint. The practical import could be staggering. Although his equations were gross parodies of the earth’s weather, he had a faith that they captured the essence of the real atmosphere. That first day, he decided that long-range weather forecasting must be doomed.

Friday, March 27, 2020

Carl Woese, Biological Physicist

The Tangled Tree: A Radical New History of Life, by David Quammen, superimposed on Intermediate Physics for Medicine and Biology.
The Tangled Tree,
by David Quammen.
Recently I listened to the audiobook The Tangled Tree: A Radical History of Life, by David Quammen. The book is a wide-ranging history of molecular phylogenetics and its central character is Carl Woese. His landmark discovery was the place of the archaea in the history of life.
The discovery and identification of the archaea, which had long been mistaken for subgroups of bacteria, revealed the present-day life at the microbial scale is very different from what science had previously depicted, and that the early history of life was very different too.
Quammen writes
Carl Woese was a complicated man—fiercely dedicated and very private—who seized upon deep questions, cobbled together ingenious techniques to pursue those questions, flouted some of the rules of scientific decorum, make enemies, ignored niceties, said what he thought, focused obsessively on his own research program to the exclusion of most other concerns, and turned up at least one or two discoveries that shook the pillars of biological thought.
How does Woese’s career intersect with Intermediate Physics for Medicine and Biology? As an undergraduate at Amherst College, Woese was a physics major. Therefore, he represents yet another example of a scientist who made the switch from physics to biology. Quammen doesn’t explore this aspect of Woese’s career much, so I searched for what motivated his change, what challenges he faced, and what advantages his physics background provided. An article in the Amherst Magazine provided some insight. While at Amherst, Woese
fell in love with physics while studying under William M. Fairbank, who would go on from Amherst to become “one of the great low-temperature physicists in the world.” Fairbank inspired Woese to go on for his physics Ph.D. at Yale, and it was there that Woese became fascinated with biophysics: the study of biological processes at the molecular level. After earning his doctorate in 1953, Woese took a brief fling at medical school (“I couldn’t bear to treat sick children, so I quit”), then studied at the famed Louis Pasteur Institute in Paris and worked for a while in an experimental biophysics lab operated by General Electric. By 1964 he had signed on at the University of Illinois where, ever since, he has taught microbiology and studied the molecular processes that go on inside single-celled creatures.
Woese’s education parallels my own: a physics major in college, followed a physics PhD but an increasing emphasis on applying physics to biology, then post doctoral study at a leading research center: the Pasteur Institute for Woese and the National Institutes of Health for me. William Fairbank plays a role in both of our careers, as undergraduate mentor to Woese and as academic grandfather to me; my PhD advisor, John Wikswo, had Fairbank as his PhD advisor. You could say that Woese was my academic uncle.

The article continues
Soon after arriving in Urbana-Champaign, Woese dared to tackle a fundamental problem in microbiology—a key problem that had stumped both Stanford's C.B. van Niel and Roger Stanier of Cal-Berkeley, the leading microbiologists of the generation preceding Woese’s. The problem, in a phrase: How could you classify—or “phylogenetically order”—the vast ranks of bacterial and other one-celled organisms, given the fact that their small size and vast complexity made it extremely difficult to study and identify their anatomical and physiological features?

Years later, after gaining a worldwide reputation for solving the problem by making the key identifications at the molecular level by sequencing genetic macromolecules and then comparing one organism’s genetic inheritance to another’s, Woese realized that his training in physics at Amherst had played a major role in his discoveries. As he later told reporters: “I hadn’t been trained as a microbiologist, so I didn’t have their bias [against classifying micro-organic species]. And my physics background had taught me the vital importance of using ‘Occam’s Razor’ whenever I could, because it had taught me that most questions—no matter how seemingly complex—usually turn out to have rather simple, straightforward answers.”
Woese returned to his physics roots later in his career. In The Tangled Tree, Quammen writes
One day in September 2002 [Woese] reached out by email to a theoretical physicist in another corner of the University of Illinois campus. Nigel Goldenfeld was an Englishman, almost thirty years younger, who had arrived in Urbana as an assistant professor, risen to full professor, and spent his middle career studying the dynamics of complex interactive systems. That included topics such as crystal growth, the turbulent flow of fluids, structural transitions in materials, and how snowflakes take shape. The common element was patterns evolving over time. Goldenfeld had never met Woese but knew him by reputation. Later, he called that first ping “the most important email of my life”… In the email, Woese now explained that he wanted to discuss—with someone—the subject of complex dynamic systems. He felt that molecular biology had exhausted its vision, he wrote, and that it needed refocusing around drastic new insights…Woese wanted a partner who understood complex interactive systems and could quantify their dynamics with brilliant math. Whether that partner knew a bacterium from an archaeon, or Darwin from Dawkins, mattered less to him.
Goldenfeld and Woese wrote several papers together, including “Life is Physics: Evolution as a Collective Phenomenon Far From Equilibrium” (Annual Review of Condensed Matter Physics, Volume 2, Pages 375-399, 2011), in which they
discuss how condensed matter physics concepts might provide a useful perspective in evolutionary biology, the conceptual failings of the modern evolutionary synthesis, the open-ended growth of complexity, and the quintessentially self-referential nature of evolutionary dynamics.
In another paper about “Biology’s Next Revolution” (Nature, Volume 445, Page 369, 2007)  they begin
One of the most fundamental patterns of scientific discovery is the revolution in thought that accompanies the acquisition of an entirely new body of data. The new window on the Universe opened up by satellite-based astronomy has in the last decade overthrown our most cherished notions of Cosmology, especially related to the size, dynamics and composition of the Universe. Similarly, the convergence of new theoretical ideas in evolution together with the coming avalanche of environmental genomic data, especially from marine microbes and viruses, will fundamentally alter our understanding of the global biosphere, and is likely to cause a revision of such basic and widely-held notions as species, organism and evolution. Here’s why we foresee such a dramatic transformation on the horizon, and how biologists will need to join forces with quantitative scientists, such as physicists, to create a biology that embraces collective phenomena and supersedes the molecular reductionism of the twentieth century.
Woese and Goldenfeld are IPMB type of people.

Quammen concludes
In later years, as he grew more widely acclaimed, receiving honors of all kinds short of the Nobel Prize, Woese seems also to have grown bitter. He considered himself an outsider. He was elected to the National Academy of Sciences, an august body, but tardily, at age sixty, and the delay annoyed him…He was a brilliant crank, and his work triggered a drastic revision of one of the most basic concepts in biology: the idea of the tree of life, the great arboreal image of relatedness and diversification.
The Place of Carl Woese in Evolutionary Biology

 Listen to David Quammen discuss The Tangled Tree.

Thursday, March 26, 2020

The Goldman-Hodgkin-Katz Equation Including Calcium

In Section 9.6 of Intermediate Physics for Medicine and Biology, Russ Hobbie and I derive the Goldman-Hodgkin-Katz equation. It accounts for both diffusion and electrical forces acting on ions in the membrane (presumably passing through ion channels spanning the lipid bilayer). If only one ion were present, its concentration on each side of the membrane would determine the equilibrium, or reversal, potential. For instance more potassium is inside a cell than outside, so diffusion pushes the positively charged potassium ions out. As the outside becomes positive, the resulting electric field in the membrane pushes potassium back in. The reversal potential, vrev, is the potential across the membrane when diffusion and electrical forces balance.

Mathematically, we can derive the reversal potential for any ion C by starting with an expression for its current density, JC


where z is the valence, e is the elementary charge, v is the potential, ωC is the permeability, NA is Avogadro's number, kB is the Boltzmann constant, T is the absolute temperature, and [C1] and [C2] are the concentrations outside and inside the membrane. (See IPMB for a derivation of this complicated equation.) To find the reversal potential, we set JC to zero and solve for v.

When more than one ion can cross the membrane, the situation is more complicated. Russ and I examined a membrane that can pass three ions: sodium, potassium, and chloride. The resulting equation for the reversal potential—also known as the Goldman-Hodgkin-Katz equation—is

We then write
When ions have different valences, the GHK equation becomes more complicated. Lewis (1979) has derived an analogous equation for transport of sodium, potassium, and calcium.
The citation is to
Lewis CA (1979) “Ion-concentration dependence of the reversal potential and the single channel conductance of ion channels at the frog neuromuscular junction.” Journal of Physiology, Volume 286, Pages 417–445.
Below is a new homework problem, based on Appendix A of Lewis’s paper, analyzing a more complicated GHK equation that includes calcium along with sodium and potassium.
Section 9.6

Problem 20 ½. Derive an expression for the Goldman-Hodgkin-Katz equation when you have three ions that can pass through the membrane: sodium, potassium, and calcium.

(a) Write down an expression like Eq. 9.53 for the current density for each ion: JNa, JK, and JCa. Hint: be careful to include the valence z properly.

(b) Assume the amount of charge in the cell does not change with time, so JNa + JK + JCa = 0. Try to solve the resulting equation for the reversal potential, vrev. You should find it difficult, because the expression for JCa has a different denominator than do JNa and JK.

(c) Define a new permeability for calcium,
Now derive an expression for vrev. Your result should look similar to Eq. 9.55, except for some factors of four, and in the numerator the new calcium permeability will be multiplied by a voltage-dependent factor.
What’s the lesson to be learned from this homework problem? First, the GHK expression including calcium has the potential on the left side of the equation, but also on the right side, inside a logarithm. No simple way exists to calculate vrev. My first thought is to use an iterative method, but I haven’t looked into this in detail. Second, notice how a small modification to the problem—changing chloride to calcium—made a major change in how difficult the problem is to solve. Adding the negative chloride ion to positive sodium and potassium resulted in a trivial change to the GHK equation (the inside chloride concentration appears in the numerator rather than the outside concentration). However, adding the divalent cation calcium totally messes up the equation, making it difficult to solve except with numerical methods.

I advocate for simple models. They provide tremendous insight. However, the moral of this story is if you push a toy model too hard, it can become complicated; it’s no longer a toy.