Thursday, May 14, 2020

The Five 1952 Hodgkin and Huxley Papers

Alan Hodgkin and Andrew Huxley published a series of five papers in the Journal of Physiology that explained the nerve action potential. In Intermediate Physics for Medicine and Biology, Russ Hobbie and I cite only the last one, which contains their mathematical model and is the most famous. Today, I’ll analyze all five papers. We’d better get started, because we have much to discuss.

Hodgkin AL, Huxley AF & Katz B (1952) “Measurement of Current‐Voltage Relations in the Membrane of the Giant Axon of Loligo.” J. Physiol., Volume 116, Pages 424—448.

This is the only one of the five papers with an extra coauthor, Bernard Katz. The first four articles were all submitted on the same day, October 24, 1951, and were published on the same day, in the April 28, 1952 issue of the Journal of Physiology. This first paper had two primary goals: describe the voltage clamp method that was the experimental basis for all the papers, and illustrate the behavior of the membrane current for a constant membrane voltage. For each paper, I’ll select one figure that illustrates the main idea (I present a simplified version of the figure, with the sign convention for voltage and current changed to match modern practice). For this first paper, I chose Fig. 11, which shows a voltage clamp experiment. A feedback circuit holds the membrane voltage at a depolarized value and records the membrane current, which consists of an initial inward current lasting about 2 milliseconds, followed by a longer-lasting outward current.
The membrane current at a constant depolarized membrane voltage during a voltage clamp experiment. Adapted from Fig. 11 of Hodgkin et al. (1952).

Hodgkin AL & Huxley AF (1952) “Currents Carried by Sodium and Potassium Ions Through the Membrane of the Giant Axon of Loligo.” J. Physiol., Volume 116, Pages 449—472.

The goal is the second paper is to separate the membrane current into two parts: one carried by sodium, and the other by potassium. The key experiment is to record the membrane current when the axon is immersed in normal seawater (mostly sodium chloride), then replace the seawater with a fluid consisting mainly of choline chloride, and finally restore normal seawater as a control to ensure the process is reversible. When sodium is replaced by the much larger choline cation the initial inward current disappears, while the outward current is little changed. This experiment, plus others, convinced Hodgkin and Huxley that the initial inward current is carried by sodium, and the long-lasting outward current by potassium.
The membrane current at a constant depolarized membrane voltage, when the axon is immersed in normal seawater (“sodium”) and in an artificial seawater with sodium replaced by choline (“choline”). Adapted from Fig. 1 of Hodgkin & Huxley (1952).

Hodgkin AL & Huxley AF (1952) “The Components of Membrane Conductance in the Giant Axon of Loligo.” J. Physiol., Volume 116, Pages 473—496.

I had a difficult time identifying on the main point of this paper, but finally I realized that the goal was to demonstrate that the behavior is best explained using sodium and potassium conductances, rather than currents or voltages. The experimental method was modified slightly by making the depolarization last only a brief one and a half milliseconds. The membrane current changes discontinuously. To see why, imagine that the extreme case of the depolarization going up to the sodium reversal potential (the membrane voltage is not depolarized quite that far in the figure below). The sodium current would be zero during the depolarization because you’re at the reversal potential. Once the membrane voltage drops back down to rest, the sodium current jumps to a large value; the sodium channels are open and now there is a voltage driving it. The sodium conductance, however, changes continuously. Hodgkin and Huxley observed, moreover, that the conductance turns on with a sigmoidal shape (not as obvious in the figure below as it is in their Fig. 13 showing the potassium conductance) but turns off exponentially, with no sign of sigmoidal behavior.
The membrane current (blue) and conductance (green) during a brief voltage clamp experiment. Adapted from Fig. 8c of Hodgkin & Huxley (1952).

Hodgkin AL & Huxley AF (1952) “The Dual Effect of Membrane Potential on Sodium Conductance in the Giant Axon of Loligo.” J. Physiol., Volume 116, Pages 497—506.

This is my favorite of the four experimental papers. It is the shortest (a mere ten pages). It examines the inactivation of the sodium channel, which is crucial for understanding the axon’s refractory period. The figure below shows their ingenious two-step voltage clamp protocol that reveals inactivation. In all three cases shown the membrane voltage changes from rest on the left to 44 mV depolarized on the right. Between these two values, however, is a tens-of-milliseconds-long holding period at different membrane voltages. When the membrane is hyperpolarized (top) the eventual sodium inward current is larger, whereas when the membrane is weakly depolarized (bottom) the inward current is smaller. Hyperpolarization removes the inactivation of the sodium channel.
The membrane voltage (red) and current (blue) during a two-step voltage clamp protocol. Adapted from Fig. 4 of Hodgkin & Huxley (1952).

Hodgkin AL & Huxley AF (1952) “A Quantitative Description of Membrane Current and its Application to Conduction and Excitation in Nerve.” J. Physiol., Volume 117, Pages 500—544.

The fifth paper was submitted March 10, 1952, more than four months after the first four, and wasn’t published until August 28, 1952, in the next volume of the Journal of Physiology. It was worth the wait. The last paper is Hodgkin and Huxley’s masterpiece, and is the most cited of the five. They introduce their mathematical model based on the voltage clamp experiments described in paper 1. They divide the membrane current up into a part carried by sodium and a part carried by potassium (plus a leak current that plays little role except in setting the resting potential), as they describe in paper 2. The model focuses on the sodium and potassium conductances, controlled by three gates: m, h, and n. By raising m to the third power and n to the fourth, they ensure the conductances turn on slowly with a sigmoidal shape, but turn off abruptly, just as they found in paper 3. The h-gate describes sodium inactivation, as reported in paper 4. The model not only reproduces their voltage clamp data, but also it predicts the action potential, all-or-none behavior, the refractory period, and even anode break excitation.
The calculated (top) and measured (bottom) action potential. Adapted from Fig. 12 of Hodgkin & Huxley (1952).

Wow! That’s an amazing set of papers.

Wednesday, May 13, 2020

The Barium Enema

A photograph of part of Page 472 of Intermediate Physics for Medicine and Biology
From Page 472 of Intermediate
Physics for Medicine and Biology
.
Intermediate Physics for Medicine and Biology: The Barium Enema Barium (Ba, element 56) is a contrast agent for x-ray imaging of the gastrointestinal tract. In Chapter 16 of Intermediate Physics for Medicine and Biology, Russ Hobbie and I describe such contrast agents.
Abdominal structures are more difficult to visualize because except for gas in the intestine, everything has about the same density and atomic number. Contrast agents are introduced through the mouth, rectum, urethra, or bloodstream. One might think that the highest-Z [highest-atomic number] materials would be best. However the energy of the K edge rises with increasing Z. If the K edge is above the energy of the x-rays in the beam, then only L absorption with a much lower cross-section takes place. The K edge for iodine is at 33 keV, while that for lead is at 88 keV. Between these two limits (and therefore in the range of x-ray energies usually used for diagnostic purposes), the mass attenuation coefficient of iodine is about twice that of lead. The two most popular contrast agents are barium (Z = 56, K edge at 37.4 keV) and iodine (Z = 53). Barium is swallowed or introduced into the colon. Iodine forms the basis for contrast agents used to study the cardiovascular system (angiography), gall bladder, brain, kidney, and urinary tract.
In Table 16.7, we mention barium again.
TABLE 16.7. Typical radiation equivalent doses for the population of the United States. (From AAPM Report 96 2008, Table 2)

       Procedure                               Equivalent dose (mSv)
Chest X-ray (Anterior Posterior)          0.1-0.2
Mammogram                                        0.3–0.6
Barium enema                                          3-6
Nuclear medicine–cardiac                      13-40
Head CT                                                   1-2
Chest CT                                                   5-7
Abdomen CT                                            5-7
Coronary CT angiography                        5-15
Third on this list is the unpleasant-sounding “barium enema.” What’s that?

A photograph of part of page 492 of Intermediate Physics for Medicine and Biology
From Page 492 of Intermediate
Physics for Medicine and Biology
.
In a barium enema, the doctor inserts a lubricated enema tube into the patient’s rectum, fills the colon with the contrast agent barium sulfate, and takes an x-ray. Patients prepare for a barium enema like they prepare for a colonoscopy: the night before they are restricted to a clear liquid diet, take laxatives, and use warm water enemas to clear out stool particles.

I like to learn by experiencing something rather than merely reading about it. I prefer to get my nose out of the book and try things, have new experiences, and live life. However, I DON’T FEEL THAT WAY ABOUT A BARIUM ENEMA. I hope you, dear reader, don’t ever gain first-hand experience with this procedure either.

Enjoy?

A photo of me giving a thumbs down, expressing my opinion of a barium enema.
My opinion of a barium enema.

Tuesday, May 12, 2020

Beethoven

The first movement of the Moonlight Sonata,   Sonata No. 14 in C♯ minor, Opus 27 No. 2,  by Ludwig van Beethoven, superimposed on Intermediate Physcs for Medicine and Biology.
The first movement of the Moonlight Sonata,
 Sonata No. 14 in C♯ minor, Opus 27 No. 2,
by Ludwig van Beethoven. Jonathan Biss
despises the name “Moonlight Sonata,”
a title not given by Beethoven.
This year we celebrate an important anniversary: 250 years since the birth of Ludwig van Beethoven, one of the world’s greatest composers. Beethoven (1770–1827) was a bridge between the classical era of Haydn and Mozart, and the romantic era of Schubert and Brahms. I know you’ve all heard the opening motif from his Fifth Symphony.

Recently, while stuck at home because of the coronavirus, I enrolled in “Exploring Beethoven’s Piano Sonatas” through Coursera. This class is taught by pianist Jonathan Biss. You can enroll free of charge and, as the old joke goes, it’s worth every penny. No, seriously, the course is outstanding; Biss gives a masterclass on how to appreciate Beethoven’s music and how to teach online (something many of us had to learn quickly when covid-19 shut down in-person classes in March). Biss’s analysis of the Appassionata (Piano Sonata No. 23 in F minor, Opus 57) is particularly memorable.

Beethoven slowly lost his hearing as he grew older, and composed many of his later works (including his masterpiece the Ninth Symphony) when he was deaf. I wonder if he would have benefited from a cochlear implant? Russ Hobbie and I mention such auditory prostheses briefly in Chapter 13 of Intermediate Physics for Medicine and Biology.
The cochlear implant… [is] a way to use functional electrical stimulation to partially restore hearing. A row of electrodes is inserted along the cochlea to stimulate the nerves that are usually excited by the hair cells. Some pitch perception can be restored by performing a Fourier analysis of a sound and stimulating neurons at different places along the cochlea.
The adagio from Sonata Pathetique,  Sonata No. 8 in C minor, Opus 13,  by Ludwig van Beethoven, superimposed on Intermediate Physics for Medicine and Biology.
The adagio from Sonata Pathétique,
Sonata No. 8 in C minor, Opus 13,
by Ludwig van Beethoven.
The date of Feb. 10, 1975 written at the top
was probably when my sister studied it,
as I don't remember playing it in high school.
Whether or not Beethoven would have been helped by such a device depends on why he went deaf. If he lost hair cells in the organ of Conti but had a healthy auditory nerve, then a cochlear implant would have been beneficial. If the auditory nerve itself was the problem, an implant would have been of no use. I don’t know what caused Beethoven’s deafness, and I’m not sure anyone does.

Beethoven’s later years were lonely, and an auditory prosthesis might have let him interact more with people. However—and with all due respect to the heroic scientists and engineers who design and build cochlear implants—he probably would have been disappointed (no, horrified) when listening to music. For a virtuoso like Beethoven, I suspect he would rather hear the music in the privacy of his own thoughts than listen through an imperfect device. If only the cochlear implant had been invented 200 years earlier, Beethoven could have decided for himself.

To learn more about auditory transduction watch this excellent video,
which includes music from Beethoven
’s the Ninth Symphony.

Jonathan Biss discusses playing Beethoven's sonatas.
He
s recording all 32.

What does Jonathan Biss do when quarantined because of the coronavirus?
He gives us a message of hope inspired by Beethoven
s struggles.

Monday, May 11, 2020

Are Tens of Thousands Dying from Radon Each Year or Not?

Radon Action Month Proclamation
by Michigan Governor Gretchen Whitmer.
Governor Whitmer declared last January to be Radon Action Month in Michigan. Just how serious of a health hazard is radon?

Russ Hobbie and I discuss radon in Chapter 16 of Intermediate Physics for Medicine and Biology.
Radon is produced naturally in many types of rock. It is a noble gas, but its decay products can become lodged in the lung. An excess of lung cancer has been well documented in uranium miners, who have been exposed to fairly high radon concentrations as well as high dust levels and tobacco smoke. Radon at lower concentrations seeps from soil into buildings and contributes a large fraction of the exposure to the general population.
The Environmental Protection Agency published A Citizen’s Guide to Radon: The Guide to Protecting Yourself and Your Family from Radon. It recommends that you fix your home if your radon level is greater than 4 pCi/L (a picocurie per liter is equal to 37 decays per second per cubic meter of air).

Let’s put that into perspective. According to EPA’s 2003 Assessment of Risks from Radon in Homes, radon causes about 21,000 lung cancer deaths per year.
Based on its analysis, EPA estimates that out of a total of 157,400 lung cancer deaths nationally in 1995, 21,100 (13.4%) were radon related. Among NS [non-smokers], an estimated 26% were radon related... The estimated risks from lifetime exposure at the 4 pCi/L action level are: 2.3% for the entire population, 4.1% for ES [smokers], and 0.73% for NS. A Monte Carlo uncertainty analysis that accounts for only those factors that can be quantified without relying too heavily on expert opinion indicates that estimates for the U.S. population and ES may be accurate to within factors of about 2 or 3.
The data listed above are 25 years old. The American Cancer Society estimates that in 2020 about 136,000 deaths in the US will be from lung cancer. The reduction compared to 1995 is probably because fewer people smoke. I don’t see any way to accurately estimate the current number of radon-related deaths in the USA, but 20,000 per year is a reasonable guess based on the EPA’s 2003 Assessment.

Does this number make sense? Assume a 5% excess risk of dying from cancer per 1 Sievert of radiation dose. If we use the background dose from radon given in IPMB of about 2 mSv/year, then the excess risk is 0.0001/year. The current population of the US is about 330 million. Multiplying 330,000,000 times 0.0001 gives 33,000. This is the same order of magnitude as our 20,000 ballpark guess. Both of these estimates are uncertain, but they suggest that a few tens of thousands of deaths in the US each year are caused by radon. While this is not as bad as the coronavirus (80,000 deaths in a couple months), it’s still worrisome.

Tens of thousands dead. Really? Such estimates are based on the controversial linear-no-threshold model. A 2016 open-access article “Rectifying Radon’s Record: An Open Challenge to the EPA” by Jeffry Siegel, Charles Pennington, Bill Sacks, and James Welsh (International Journal of Radiology and Imaging Technology, Volume 2, Article Number 014) states
The American Lung Association has recently led a national workgroup to develop The National Radon Action Plan: A Strategy for Saving Lives. The U.S. Environmental Protection Agency (EPA) is the lead governmental organization projected to implement this plan. The stated intent of the plan is to address the “radon problem” in the United States, with the aim of saving 3,200 lives by the year 2020 through preventing at least a portion of the lung cancer mortality that is assumed to arise from inhaling modest doses of radon in homes, offices, and buildings. The plan identifies a number of actions that government can take in the spirit of saving lives by avoiding the inhalation of radon and its progeny. We are among a growing number of investigators who recognize the substantial body of evidence demonstrating that the radiation doses associated with indoor radon inhalation are not harmful. Radon, at these doses, is unlikely to be a cause of lung cancer, and, on the contrary, may be beneficial in various ways, including its paradoxical tendency to protect against lung cancer. In the present paper, we review and critique the past policies of the EPA with respect to indoor radon and the very impetus for the plan. We indicate that the plan should not be implemented because a preponderance of the evidence indicates an unintended consequence: implementation of the plan is likely to increase, rather than decrease, the risk of lung cancer.
What are we to believe? I don’t know the real risk of radon exposure. One thing I do know is that we need to figure out whether or not the linear-no-threshold model is correct. Are tens of thousands of our citizens dying each year from radon exposure? It seems to me that with so many lives at stake, our nation needs to invest the time and money necessary to answer this question. Either the EPA overestimates the risk, in which case we can focus on other more pressing issues, or it accurately estimates the risk, in which case we have an epidemic on our hands.

Friday, May 8, 2020

Ping Pong

A ping pong paddle on top of Intermediate Physics for Medicine and Biology.
When I was in a teenager, I played a lot of ping pong. It was the sport that I played best (which isn’t saying much) and loved most (except for baseball). Dad bought a ping-pong table for the family when I was young, and he was my first opponent. As I grew up, I spent hours practicing with friends, perfecting our serves, slices, and slams. In high school, my friend Terry Fife and I played hundreds of games, and we were evenly matched. The psychological warfare during those battles was fierce.

I continued playing ping pong in college. I bought one of those paddles that has foam under the rubber so the ball stays in contact with the surface for a long time, letting you impart more spin. During my first two years at the University of Kansas, I studied but also spent a lot of time playing ping pong at the dorm. I was better than most of the guys, although my friend Son Do could beat me, much to my chagrin. Too many evenings were squandered playing cards or ping pong. Only during my last couple years at KU did I get serious about physics.

Life in Moving Fluids,
by Steven Vogel.
Understanding ping pong requires us to discuss the Magnus effect, which Steven Vogel illustrates by considering a spinning cylinder in a flowing fluid. In Life in Moving Fluids—a book often cited in Intermediate Physics for Medicine and Biology—Vogel writes
A look at the resulting streamlines (Figure 10.12 [a modified version of which is shown below]) clarifies what’s happening in this superposition of rotation and translation of a cylinder. On one side of the cylinder the two motions in the fluid oppose one another, so the velocities are lower and the streamlines are farther apart. On the other side, the motions are additive, velocities are increased, and the streamlines are closer together. By Bernoulli’s principle pressure will be elevated on the side where flow speeds are lower and will be reduced on the side where the speeds are higher. Thus a net pressure or force will act in a direction normal to the free-speed flow—in short, lift
Figure 10.12. If a solid body such as a cylinder rotates as it translates through a fluid, the resulting asymmetry of flow generates a force normal to the free-stream flow. We call this force lift. Adapted from Life in Moving Fluids by Steven Vogel.
This phenomenon, the lift of a rotating cylinder moving through a fluid, is called the “Magnus effect,” after H. G. Magnus (1802-1870).

The Magnus effect (at a little lower intensity) works for spheres as well as for cylinders. It’s a really big deal in sports in which spheres are thrown, hit, or otherwise put into motion since (except for a golf slice) a confusingly nonstraight course is distinctly meritorious. Two pleasant books on such contemporary compulsions are Sport Science, by P. J. Brancazio (1984), with good references, and The Physics of Baseball, by R. K. Adair (1990), with more on the Magnus effect specifically.
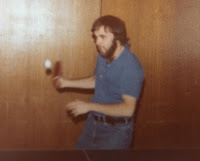
Me playing ping pong at the
University of Kansas, circa 1980.
Vogel’s description of the Magnus effect is clear and interesting, but I think it’s not very relevant. In ping pong, the goal of spin is not to make the ball follow a curved path through the air, but instead is to make the ball leave your opponent’s paddle traveling in the wrong direction! After putting backspin on the ball, I loved to see Terry Fife’s return dive into the net. And I enjoyed nothing more than giving the ball some sidespin, and then watching Son Do’s next hit miss the table on the right. Those were the days!

Thursday, May 7, 2020

Intensity-Modulated Radiation Therapy

Radiation Oncology: A Physicist's-Eye View,
by Michael Goitein.

In an earlier post, I mentioned Michael Goitein textbook Radiation Oncology: A Physicist’s Eye View. In Intermediate Physics for Medicine and Biology, Russ Hobbie and I cite Goitein’s book when we discuss intensity-modulated radiation therapy.
In classical radiotherapy, the beam was either of uniform fluence across the field, or it was shaped by an attenuating wedge placed in the field. Intensity-modulated radiation therapy (IMRT) is achieved by stepping the collimator leaves during exposure so that the fluence varies from square to square in Fig. 16.45 (Goitein 2008; Khan 2010, Ch. 20)

It was originally hoped that CT reconstruction techniques could be used to determine the collimator settings at different angles. This does not work because it is impossible to make the filtered radiation field negative, as the CT reconstruction would demand. IMRT with conventional treatment planning improves the dose pattern (Goitein (2008); Yu et al. (2008)), providing better sparing of adjacent normal tissue and allowing a boost in dose to the tumor.
Goitein’s analysis of IMRT is full of insight, and I quote an excerpt below. Enjoy.

INTENSITY-MODULATED RADIATION THERAPY (IMRT)

So far, we have implicitly assumed that each radiation field is near-uniform over its cross section; dose uniformity of a field within the target volume has, in fact, historically been an explicit goal of radiotherapy. However, the radical suggestion to allow the use of non-uniform fields was made some two decades ago, independently by Anders Brahme and Alan Cormack, fresh from co-inventing the CT scanner—and, in the context of π-meson therapy... (Cormack 1987; Brahme 1988; Pedroni 1981). Their idea was based on the judgment that, using mathematical techniques, an irradiation scheme using non-uniform beams could be found which would more closely achieve the ideal of delivering the desired dose to the target volume while limiting the dose to the normal tissues outside the target volume to some predefined value.

Brahme’s and Cormack’s approaches were motivated by the observation that, in CT reconstruction, one can deduce from the intensity reduction of X-rays traversing an object along a series of straight paths what the internal structure of the object is. By inverting the mathematics, one can deduce the intensities ( pencil beam weights) of a series of very small beams (pencil beams) that pass through the object and deliver dose within it. This procedure leads to highly nonuniform individual fields which, in combination, deliver the desired (usually, uniform) dose to the target volume.

There are two very substantial flaws to the original idea. The first is that, when the problem is posed to deliver zero dose outside the target volume as was initially proposed, many of the computed intensitiesare negative—a highly unphysical result. The second is that there is no a priori way of specifying a physically possible dose distribution to serve as the goal of the optimization.

However, the basic idea of using non-uniform beams has proven enormously fruitful. A workable computational solution is to use optimization algorithms to iteratively adjust the pencil beam weights such that the resulting dose distribution maximizes some score function. The search is computationally intensive and therefore poses interesting technical challenges. However, the still bigger challenge is to find score functions which give a viable measure of clinical goodness. Increasingly, biophysical models of the dose-response of both tumors and normal tissues are being investigated and are beginning to be used as elements of such score functions. These matters are discussed in Chapters 5 and 9.

Intensity-modulated radiation therapy (IMRT), as treatments featuring non-uniform beams are called, has been most intensely developed for X-ray therapy. However, it is equally appropriate for other radiation modalities—including protons. With charged particles one has an extra degree of freedom. One can vary the beam intensity as a function of lateral position and as a function of penetration (energy).
Who was Michael Goitein? Below is an excerpt from his 2017 obituary in the International Journal of Radiation Oncology Biology Physics.
Michael Goitein was a visionary thought provocateur and is rightly judged to have been an exceptionally innovative and creative physicist in radiation oncology (Fig. 1). He was a critical player in the development of proton radiation therapy, with many of his advances widely used in current proton and photon therapy. His highly important and numerous contributions to medical science have been well rewarded with many important awards: Fulbright Fellowship, 1961-65; US Research Career Development Award, 1976-81; Fellow, American Association of Physicists in Medicine, 2000; Gold Medal of the American Society for Radiation Oncology, 2003; and Lifetime Achievement Award of the European Society for Radiotherapy and Oncology, 2014. Significantly, he was a cofounder of the Proton Therapy Co-Operative Oncology Group and served as the second president. Furthermore, he participated in many of its subsequent functions. In addition, Michael was an invited lecturer at a long list of national and international conferences and medical centers. He published 163 articles and 3 books that have positively affected the practice of radiation oncology (1). It must also be mentioned that he has authored 4 books of a personal nature, one of which is a book of his poems (2, 3, 4, 5).
To learn more, read his ASTRO interview.

Wednesday, May 6, 2020

Never at Rest

Never at Rest, by Richard Westfall.
Isaac Newton’s name appears many times in Intermediate Physics for Medicine and Biology. You can learn more about him in Richard Westfall’s wonderful book Never at Rest: A Biography of Isaac Newton. As we all sit in quarantine because of the coronavirus pandemic, I thought you might like to read about Newton’s experience with the plague. Here is an excerpt from Never at Rest.
In the summer of 1665, a disaster descended on many parts of England including Cambridge. It had “pleased Almighty God in his just severity,” as Emmanuel College put it, “to visit this towne of Cambridge with the plague of pestilence.” Although Cambridge could not know it and did little in the following years to appease divine severity, the two-year visitation was the last time God would choose to chastise them in this manner [until 2020]. On 1 September, the city government canceled Sturbridge Fair [one of the largest fairs in Europe] and prohibited all public meetings. On 10 October, the senate of the university discontinued sermons at Great St. Mary’s and exercises in the public schools. In fact, the colleges had packed up and dispersed long before. Trinity [College, Cambridge] recorded a conclusion on 7 August that “all Fellows & Scholars which now go into the Country upon occasion of the Pestilence shall be allowed [the] usual Rates for their Commons for [the] space of [the] month following...” For eight months the university was nearly deserted…

Many of the students attempted to continue organized study by moving with their tutors to some neighboring village. Since Newton was entirely independent in his studies and had had his independence confirmed with a recent B.A. [Newton received his bachelors degree in August 1665],… he returned… to Woolsthorpe [the Newton family home]...

Much has been made of the plague years in Newton’s life. He mentioned them in his account of mathematics. The story of the apple [hitting him on the head, triggering the discovery of the universal law of gravity], set in the country, implies the stay in Woolsthorpe. In another much-quoted statement written in connection with the calculus controversy [a debate between Newton and Leibniz about who first invented calculus] about fifty years later, Newton mentioned the plague years again.
In the beginning of the year 1665 I found the Method of approximating series & the Rule for reducing any dignity of any Binomial into such a series [the binomial theorem]. The same year in May I found the method of Tangents of Gregory & Slusius [a way of finding the slope of a curve], & in November had the direct method of fluxions [diferential calculus] & the next year in January had the Theory of Colours [later published in Opticks] & in May following I had entrance into [the] inverse method of fluxions [integral calculus]. And the same year I began to think of gravity extending to [the] orb of the Moon & (having found out how to estimate the force with [which a] globe revolving within a sphere presses the surface of the sphere) from Keplers rule of the periodical times of the Planets being in sesquialterate proportion [to the 3/2 power] of their distances from the center of their Orbs, I deduced that the forces [which] keep the Planets in their Orbs must [be] reciprocally as the squares of their distances from the centers about [which] they revolve [the inverse square law]: & thereby compared the force requisite to keep the Moon in her Orb with the force of gravity at the surface of the earth and found them answer pretty nearly. All this was in the two Plauge years of 1665-1666. For in those days I was in the prime of my age for invention and minded Mathematicks & Philosophy [physics] more than at any time since.
 So what are you doing while stuck at home during the coronavirus pandemic?

Tuesday, May 5, 2020

A Toy Model For Tomography

In Chapter 12 of Intermediate Physics for Medicine and Biology, Russ Hobbie and I discuss tomography. The algorithms for solving the tomography problem involve calculus, Fourier analysis, and convolutions. I love all that mathematics, but some people don’t (😮). Is there a way to introduce tomography to students who don’t have a mathematical background?

Let’s start with a simple object divided into six pixels. Our goal is to determine the value of some property for each pixel. If this were positron emission tomography, this property would be the concentration of a radioactive substance. If this were a CT scan, this property would be the x-ray absorption. How we interpret the property doesn’t matter; we’re just going to assign a number to each pixel.

The Froward Problem

Suppose this is your object.


We assume what you can measure is the sum of the pixels along one direction: a projection.

You can take projections from different orientations; sum the pixels in that direction.
A tomography machine in the hospital measures projections.

The Inverse Problem

So far we have examined the forward problem: determine the projections from the object. Next, consider the inverse problem: determine the image from the projections. Here’s another example.

How do you obtain an image of the object from multiple projections? That is the fundamental problem of tomography. In other words, how do you figure out what number to put into each pixel so that it gives the projections shown above? Stop reading and try to guess the image. When you’re done, continue reading.

Perhaps you found this image.
Good job, but your friends working from the same projections may have found different images.

Check for yourself; they all have the same three projections. If you permit negative values, you can find even more images.
The values don’t have to be integers.
The number of solutions is infinite. What can we do to pick the correct image? Use more projections!

You’ll find only one image consistent with all six projections: the first one I listed (try it yourself). If you have enough projections, you can find a unique image. You’ve solved the problem of tomography.

If you add noise to the projections, you may have no solution. In that case, you would need to use something like the least squares method to estimate the image. But that’s another story.

If you have only six pixels (and no noise) you can compute the image using trial and error, and some logic, sort of like Sudoku. A medical image, however, might have tens of thousands of pixels! What do you do then? That’s exactly what Russ and I discuss in Chapter 12 of Intermediate Physics for Medicine and Biology.

I will leave you with a final example to solve on your own. Enjoy!

Monday, May 4, 2020

IPMB Scavenger Hunt!

Here in Michigan Big Gretch has us all stuck at home cause of rona, and some of you might be quarantined with a younger brother. What can you do with him that is both educational and fun? Try the Intermediate Physics for Medicine and Biology Scavenger Hunt!

In the first section of IPMB, Russ Hobbie and I talk about distances and sizes. We show a couple illustrations (Figures 1.1 and 1.2) containing biological objects drawn to scale. Our goal is to help you build intuition about the relative size of things. This is an important skill, both for a sophomore premed student and for your third-grade niece. So, grab your little rug-rat and let’s play. Start with a picture of severe acute respiratory syndrome coronavirus, the virus that causes covid-19.

The starting point for playing IPMB Scavenger Hunt!
This game is best played in Powerpoint, so I suggest downloading the .pptx version of the figure. Now, you and your little sister search the internet for pictures of biological objects, copy and paste them into the figure, and label them. Make sure you expand or contract the image so its size matches the scale bars in the figure. You should be able to fit eight to ten objects in the picture before it gets crowded. When done, you will have created your own version of Fig. 1.1 or 1.2. But yours will be cooler that ours, because it will be in color and will probably contain real images as opposed to poorly drawn cartoons. An example that I created is shown below.

An example of playing Intermediate Physics for Medicine and Biology Scavenger Hunt.
An example resulting from playing IPMB Scavenger Hunt! A couple good sources of pictures are the CDC Image Library, and the Molecule of the Month Website.
What are the goals of this activity?
If your young cousin doesn’t want to stop, you can create your own version of the game using a larger or smaller initial object (perhaps a nerve axon and a 10 micron scale bar).

Your tenderfoot friend may select objects that don’t fit into the figure. For instance, she may want to include a red blood cell, which is too large for the slide. Don’t say no. Find an object around the house (perhaps a pillow) that is about the size of a red blood cell on this scale, thereby reinforcing the relative size of things. Don’t worry if you don’t have Powerpoint. Instead, pick your own size scale (for example, one foot equals one micron) and go around the house collecting everyday objects to represent “viruses,” “bacteria,” and “cells.” The only requirement is that they are all to scale.

If the little fella can’t get enough biology, have him look at some of David Goodsell’s drawings (be sure to see his latest coronavirus painting, below). If you have plenty of time and money, buy him a plush covid-19 toy.

Enjoy!
The coronavirus.
Illustration by David S. Goodsell, RCSB Protein Data Bank;
doi: 10.2210/rcsb_pdb/goodsell-gallery-019

Friday, May 1, 2020

Faust in Copenhagen

Faust in Copenhagen, by Gino Segrè, superimposed on Intermediate Physics for Medicine and Biology.
Faust in Copenhagen,
by Gino Segrè.
My friend and fellow biological physicist Gene Surdutovich loaned me his copy of Faust in Copenhagen: A Struggle for the Soul of Physics, by Gino Segrè. It’s about seven physicists—Niels Bohr, Max Delbrück, Paul Dirac, Paul Ehrenfest, Werner Heisenberg, Lise Meitner, and Wolfgang Pauli—who played a key role in the development of quantum mechanics in the 1920s. Segrè uses a 1932 meeting in Copenhagen as the hinge about which his story revolves.
This is a book about seven physicists, six men and one woman, who attended a small annual gathering in Copenhagen in April 1932. To be honest, only six of them were actually there. The seventh, Wolfgang Pauli, had originally intended to go, as he had in earlier years and would do so again, but he decided that spring instead to take a vacation. He was there in spirit, as you will see.
Of the seven, the one who plays the least significant role in the story is Delbrück. Nevertheless, he is the one most closely related to Intermediate Physics for Medicine and Biology. One topic I have examined in this blog is how scientists make the transition from physics to biology. Below I provide brief excerpts from Faust in Copenhagen, explaining how Delbrück did it. It appears in the book’s epilogue; I will add links and fill in background that you would have known had you read the rest of the book.

How Delbrück Became a Biologist

While working as the “family-theorist” in Meitner’s laboratory [in Berlin, she was the only experimental physicist of the seven], Delbrück often returned to see Bohr [his former mentor] and the continually changing group at Blegdamsvej [a street in Copenhagen where Bohr’s institute was located]. After the April 1932 meeting he had gone back to Berlin but in August was once again in Copenhagen. Sleepily stepping out of the carriage of the overnight train from Berlin, Delbrück was surprised to see Bohr’s trusted collaborator Leon Rosenfeld waiting for him with a message from Bohr. Delbrück was to go straightaway to the great meeting hall of the Rigsdag, the Danish parliament, where Bohr was about to deliver the opening lecture at the International Congress of Light Therapists… Knowing Delbrück’s interest in biology, Bohr wanted him to attend. This turned out to be the talk that changed Delbrück’s life [my italics].

In 1932 some biologists still clung to the notion that special forces not described by the ordinary laws of physics and chemistry were responsible for the existence of life… [In his talk, Bohr] asked: Could complementarity apply to life itself? [Complementarity was the principle that two opposing properties could both be true, but could not be observed simultaneously.] Perhaps the distinction between living and nonliving was not so easy to understand. Might the act of measurement be a critical step in the assessment [as it is in the Copenhagen interpretation of quantum mechanics]?...

Bohr thought there might be some intangible quality that differentiates living from nonlinving, a quality that could not be precisely quantified. He was not alluding to a divine spark, but rather to something analogous to the impossibility of saying with certainty whether light is a photon or a wave. Bohr’s conjecture was provocative, as it was meant to be, but in the end it turned out to be wrong. DNA and RNA are the answer to life, not complementarity.

But the potential connection between physics and biology had surfaced. Would Delbrück have become a biologist if he had not thought he might find something like complementarity at the root of life’s existence? Would molecular biology have developed as it did without the structure imposed on it by the discipline Delbrück had learned from Bohr? Many who know the field think the answer to both questions is no. When James Watson wrote Delbrück in 1953 that he and Francis Crick had found their double helix model of DNA, Delbrück was struck by the elegance of the structure, but disappointed by its simplicity. Hearing that life did not require any basic new principles, he remarked that if felt to him as if the hydrogen atom had been fully explained in the 1920s without the need for quantum mechanics. [The Bohr model explained the spectrum of hydrogen in 1913, but the more modern theory of quantum mechanics refined and improved that model in the 1920s.]

By then Delbrück had become a Bohr-life figure in the new field of molecular biology [Bohr, one of the senior members of the group of seven along with Ehrenfest and Meitner, was much loved as a mentor and father-figure as well as a scientist]. He had created at Cold Spring Harbor Laboratory on Long Island and at the California Institute of Technology Copenhagen-like atmospheres for young biologists…

[Delbrück], together with Salvador Luria and Alfred Hershey, with whom he shared the 1969 Nobel Prize in Physiology or Medicine, had shown how bacteriophages, the viruses that attack bacteria, were the simplest and most efficient tool for studying genetics… In many ways the importance of these findings were comparable to Bohr’s 1913 discovery of the rules for the hydrogen atom’s radiation...

Perhaps these qualities [of personality that are similar to Bohr’s, of integrity and intellectual openness] are the basis of the deep lifelong link between Pauli and Debrück. Luria, in his memoirs, remembered his first meeting with Delbrück. At the time both were recent refugees from Europe. It was New York City in late December 1941, only a few weeks after Pearl Harbor:
Max took me to dinner with two other scientists, one of them the great physicist Wolfgang Pauli. I was properly intimidated, but Pauli simply asked me “Sprechen Sie Deutsch?” and without waiting for a reply proceeded to eat and speak German so prodigiously fast that I understood not a word [of the seven, only Bohr (Danish) and Dirac (English) did not speak German as their first language]. I would have been even more scared had I known of Pauli’s classic remark “So young and he has already contributed so little.” [Pauli was known and loved for his quick and biting wit.]
Fortunately young Luria soon contributed a great deal.

As for Pauli, his last significant letter, written two months before he died, was a twelve-page one to Max. Beginning with a discussion of the festivities for Lise Meitner’s eightieth birthday, it ends on a more personal note: “I cannot forget the dear manner, which goes back to old times, when you took leave of me. I have the impression that here something has been renewed between us that is important.”

Delbrück would hike and camp with young biologists in the Southern California desert rather than walk with then along the North Sea shore of Denmark [where Bohr had walked with young Heisenberg, discussing quantum mechanics], but the spirit was the same as Bohr’s had been. On the other hand, rather than Bohr’s polite, “I don’t mean to criticize, only to understand,” Max remained famous for his rudeness... Though the spirit was Bohr’s, the style was Pauli’s...

Delbrück died in 1981 in California.
Looking for a good read while cooped up in your house because of the coronavirus? I recommend Faust in Copenhagen. It’s wunderbar.