Friday, March 1, 2024

A Text-Book on Medical Physics

Intermediate Physics for Medicine and Biology provides, for the first time, a textbook about the role that physics plays in medicine.

Well… no.

I recently found a textbook that preceded IPMB by over a century. Below is its preface.
The fact that a knowledge of Physics is indispensable to a thorough understanding of Medicine has not yet been as fully realized in this country as in Europe, where the admirable works of Desplats and Gariel, of Robertson, and of numerous German writers, constitute a branch of educational literature to which we can show no parallel. A full appreciation of this, the author trusts, will be sufficient justification for placing in book form the substance of his lectures on this department of science, delivered during many years at the University of the City of New York.

Broadly speaking, this work aims to impart a knowledge of the relations existing between Physics and Medicine in their latest state of development, and to embody in the pursuit of this object whatever experience the author has gained during a long period of teaching this special branch of applied science. In certain cases topics not strictly embraced in the title have been included in the text—for example, the directions for section-cutting and staining; and in other instances exceptionally full descriptions of apparatus have been given, notably of the microscope; but in view of the importance of these subjects, the course pursued will doubtless be approved. Attention may be called to the paragraph headings and italicized words, which suggest a system of questions facilitating a review of the text.

In conclusion, the author will feel that his labor has not been in vain if the work should serve to call deserved attention to a subject hitherto slighted in the curriculum of medical education.
Readers of IPMB might be interested in a brief table of contents for this earlier book.
I. Matter
      1. Properties of matter
      2. Solid matter
      3. Liquid matter
      4. Gaseous matter
      5. Ultragaseous and radiant matter
II. Energy

               1. Potential energy 

               2. Kinetic energy 

               3. Machines and instruments 

               4. Translatory molecular motion 

               5. Acoustics 

               6. Optics 

               7. Heat 

               8. Electricity 

               9. Dynamic electricity 

             10. Magnetism 

             11. Electrobiology

Many of these topics are familiar to readers of IPMB. Yet, the list and the language seem quaint and just a little old-fashioned.
A Text-Book on Medical Physics,
by John C. Draper.

This should not be surprising. The book was titled A Text-Book on Medical Physics, written by John C. Draper, and published in 1885. Russ Hobbie and I are following a long tradition of applying physics to medicine and biology. In nearly 140 years much has changed, but also much has stayed the same. The last sentence of the preface could serve as our call to arms, and the subtitle of Draper’s book could be our own: “For the Use of Students and Practitioners of Medicine.” 

Below I post the definition of medical physics in the Text-Book. I love it. Draper should have written a blog!


Friday, February 23, 2024

The Rest of the Story 4

Allan was born in Johannesburg, the youngest of three children. He spent his teenage years in Cape Town, and was interested in debating, tennis, and acting. He also loved astronomy, which triggered an interest in physics and mathematics.

At the University of Cape Town he studied electrical engineering, following in the footsteps of his father and brother. But he soon abandoned engineering to learn physics and to engage in mountaineering. After he obtained his undergraduate degree, he went to England and studied physics at the Cavendish Laboratory in Cambridge

He didn’t finish his PhD, however, because in Paul Dirac’s quantum mechanics class he fell in love with one of his classmates, an American physics student named Barbara Seavey. He wanted to marry her but he had no money. As fortune would have it, there was a teaching position available back in Cape Town. He married Barbara and returned home to South Africa. There he was happy, but isolated from cutting edge research. He didn’t seem posed for success in the high-power and competitive world of physics.

Page 2

At Cape Town Allan eventually qualified for a sabbatical, which Barbara wanted to spend in the United States. So they traveled to the Harvard cyclotron, where he worked on nucleon-nucleon scattering with Norman Ramsey and Richard Wilson. While on sabbatical leave, he was offered a position at Tufts University.

Allan became interested in a computer imaging problem: how to make a 2-d image of the inside of an object based on projections taken at different angles. He published the results of this work, but it didn’t make a splash. No one seemed to care about his algorithm. So he went back to his research on high energy physics.

Several years latter, researchers suddenly began to pay attention to Allan’s imaging work. Medical doctors were interested in forming two- or even three-dimensional images of the body using X-rays applied from different directions. Allan’s algorithm was exactly what they needed.

These studies became fundamental to the emerging field of medical imaging. It was so important, that in 1979 he—Allan MacLeod Cormack—and Godfrey Hounsfield shared the Nobel Prize in Physiology or Medicine for the invention of computed tomography.

And now you know the rest of the story.

Good day!

***************************

Imaging the Elephant: A biography of Allan MacLeod Cormack. by Christopher Vaughan, superimposed on Intermediate Physics for Medicine and Biology.
Imagining the Elephant:
A Biography of Allan MacLeod Cormack
.
by Christopher Vaughan.

This blog post was written in the style of Paul Harvey’s “The Rest of the Story” radio program. You can find three other of my “The Rest of the Story” blog posts here, here, and here.

The content is based on Cormack’s biography on the Nobel Prize website. You can read about tomographic reconstruction techniques in Chapter 12 of Intermediate Physics for Medicine and Biology.

Allan MacLeod Cormack was born on February 23, 1924, exactly 100 years ago today. 

Happy birthday Allan!

Friday, February 16, 2024

Forman Acton (1920 – 2014)

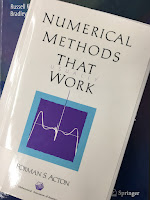
Numerical Methods That Work, by Forman Acton superimposed on Intermediate Physics for Medicine and Biology.
Numerical Methods That Work,
by Forman Acton.
The American computer scientist Forman Acton died ten years ago this Sunday. In Intermediate Physics for Medicine and Biology, Russ Hobbie and I cite Acton’s Numerical Methods That Work. For readers interested in using computers to model biological processes, I recommend this well written and engaging book.

Before he died, Acton donated funds to establish the Forman Acton Foundation. Here is how their website describes his life:
Forman Sinnickson Acton was born in Salem City, and he went on to change the world.

Born on August 10, 1920, he began his education in the Salem City school system before attending private boarding school at Phillips Exeter Academy and college at Princeton University. He graduated with two degrees in engineering toward the end of World War II, during which he served in the Army Corps of Engineers and worked on a team involved in the Manhattan Project.

After his service, he earned his doctorate in mathematics from Carnegie Institute of Technology, helped the Army develop the world’s first anti-aircraft missiles and became a pioneer in the evolving field of computer science.

Acton conducted research and taught at Princeton from 1952 to 1990, during which time he wrote textbooks on mathematics at his cabin on Woodmere Lake in Quinton Township, Salem County. When he turned 80, he joined the Lower Alloways Creek pool to stay in shape, swimming six days a week for 14 years.

He died on February 18, 2014, in Woodstown, New Jersey, but not before he anonymously donated thousands of dollars toward scholarships for Salem City School District students, some of whom were just then graduating from college. Before he passed, he made it clear to friends and confidants that he wanted these students to have access to the incredible educational experiences he enjoyed.

Eight months after his passing, the Forman S. Acton Educational Foundation was officially incorporated to ensure that all of Salem’s youth also have a chance to change the world.
Sometimes I will read a passage and say to myself “That’s exactly what students studying from IPMB need to hear.” I feel this way about Acton’s preface to Numerical Methods That Work. Russ and I include many homework problems in IPMB so the student can gain experience with the art of mathematical modeling. Below, in Acton’s words, is why we do that. Just replace phrases like “solving equations numerically” with “building models mathematically” and his words apply equally well to IPMB.
Numerical equation solving is still largely an art, and like most arts it is learned by practice. Principles are there, but even they remain unreal until you actually apply them. To study numerical equation solving by watching someone else do it is rather like studying portrait painting by the same method. It just won’t work. The principle reason lies in the tremendous variety within the subject…

The art of solving problems numerically arises in two places: in choosing the proper method and in circumventing the main road-blocks that always seem to appear. So throughout the book I shall be urging you to go try the problems—mine or yours.

I have tried to make my explanations clear, but sad experience has shown that you will not really understand what I am talking about until you have made some of the same mistakes I have made. I hesitate to close a preface with a ringing exhortation for you to go forth to make fruitful mistakes; somehow it doesn’t seem quite the right note to strike! Yet, the truth it contains is real. Guided, often laborious, experience is the best teacher for an art.


Friday, February 9, 2024

Robert Kemp Adair (1924–2020)—Notes on a Friendship

Robert Adair.
Robert Adair.
Photo credit: Michael Marsland/Yale University.

I try to write obituaries of scientists who appear in Intermediate Physics for Medicine and Biology, but for some reason I didn’t write about Robert Adair’s death in 2020. Perhaps the covid pandemic over-shadowed his demise. In Chapter 9 of IPMB, Russ Hobbie and I cite seven of his publications. He was a leader in studying the health effects (or, lack of heath effects) from electric and magnetic fields.

Recently, I read a charming article subtitled “Notes on a Friendship” about Adair, written by Geoffrey Kabat, the author of Getting Risk Right: Understanding the Science of Elusive Health Risks. I have Getting Risk Right on my to-read list. It sounds like my kind of book.

I admire Adair’s service in an infantry rifle platoon during World War II. I loved his book about baseball. I respect his independent assessment of the seriousness of climate change, although I don’t agree with all his conclusions. He certainly was a voice of reason in the debate about health risks of electric and magnetic fields. He led a long and useful life. We need more like him.

I will give Kabat the final word, quoting the last paragraph of his article.
In early October 2020, Bob’s daughter Margaret called me to tell me that Bob had died. I looked for an obituary in the New York Times, and was shocked when none appeared, likely due to the increased deaths from the pandemic. I wrote to an epidemiologist colleague and friend, who knew Bob’s work on ELF-EMF [extremely low frequency electromagnetic fields] and microwave energy, and who had served on a committee to assess possible health effects of the Pave Paws radar array on Cape Cod. My friend Bob Tarone wrote back, “Very sad to hear that. Adair was not directly involved in the Pave Paws study, but we relied heavily on his superb published papers on the biological effects of radio-frequency energy in our report. He and his wife were superb scientists. Losing too many who don’t seem to have competent replacements. Too bad honesty and truth are in such short supply in science today.” He concurred that there should have been an obituary in the Times.

Friday, February 2, 2024

“Havana Syndrome”: A post mortem

“Havana Syndrome”: A Post Mortem, by Bartholomew and Baloh, superimposedo on Intermediate Physics for Medicine and Biology.
“Havana Syndrome”: A Post Mortem,
by Bartholomew and Baloh.
Remember the Havana Syndrome? You don’t hear much about it anymore. Recently I read an article titled “‘Havana Syndrome’: A Post Mortem,” by Robert Bartholomew and Robert Baloh. These two researchers are long-time skeptics who don’t believe that the Havana Syndrome was caused by a physical attack on US and Canadian diplomats. They are also critical of the National Academies report that suggested microwave weapons might be responsible for the Havana Syndrome. I came to a similar conclusion in my book Are Electromagnetic Fields Making Me Ill?, where I wrote
At this time, we have no conclusive explanation for the Havana syndrome. We need more evidence. Measuring intense beams of microwaves should be easy to do and would not be prohibitively expensive. Until someone observes microwaves associated with the onset of this illness, I will remain skeptical of the National Academies’conclusion.
Bartholomew and Baloh believe that the Havana Syndrome is psychogenic. In my book, I make an analogy to post traumatic stress syndrome: it’s a real disease, but not one with a simple physical cause. Below I quote the abstract from Bartholomew and Baloh’s paper.
Background: Since 2016, an array of claims and public discourse have circulated in the medical community over the origin and nature of a mysterious condition dubbed “Havana Syndrome,” so named as it was first identified in Cuba. In March 2023, the United States intelligence community concluded that the condition was a socially constructed catch-all category for an array of health conditions and stress reactions that were lumped under a single label.
Aims: To examine the history of “Havana Syndrome” and the many factors that led to its erroneous categorization as a novel clinical entity.
Method: A review of the literature.
Results/Conclusions: Several factors led to the erroneous classification of “Havana Syndrome” as a novel entity including the failure to stay within the limitations of the data; the withholding of information by intelligence agencies, the prevalence of popular misconceptions about psychogenic illness, the inability to identify historical parallels; the role of the media, and the mixing of politics with science.

In Intermediate Physics for Medicine and Biology, Russ Hobbie and I discuss the health effects of electromagnetic fields. It’s crucial to understand the physics that underlies tissue-field interactions before postulating a nefarious role for electromagnetic fields in human health. If you suggest an idea that is not consistent with physics, prepare to be proved wrong.

A final note: Baloh and Bartholomew write

In September 2021, the head of a U.S. Government panel investigating “Havana Syndrome,” Pamela Spratlen, was forced to resign after refusing to rule out [mass psychogenic illness] as a possible cause... A former senior C.I.A. operative wrote that Spratlen’s position was “insulting to victims and automatically disqualifying.”
I think we all owe Pamela Spratlen an apology. Thank you for your service.

 Was “Havana Syndrome” a case of mass hysteria? DW News.

https://www.youtube.com/embed/ljf1TVWTSlQ

 
Havana Syndrome: Tilting at Windmills?

https://www.youtube.com/watch?v=4IWnhmqVsPc


 The Havana Syndrome: A Disorder of Neuropolitics?

https://www.youtube.com/watch?v=izeVdfkYnIo

Friday, January 26, 2024

Craig Henriquez (1959–2023)

I just learned that my friend Craig Henriquez passed away last summer. Craig earned his PhD at Duke University in their Department of Biomedical Engineering under the guidance of the renowned bioelectricity expert Robert Plonsey. His 1988 dissertation, titled “Structure and Volume Conductor Effects on Propagation in Cardiac Tissue,” was closely related to work I was doing at that time. Craig sent me a copy of his dissertation after he graduated. I really wanted to read it, but I was swamped with my my new job at the National Institutes of Health and helping care for my newborn daughter Stephanie. There wasn’t time to read it at work, and when I got home it was my turn to watch the baby, as my wife had been with her all day. The solution was to read Craig’s dissertation out loud to Stephanie as she crawled around in her play pen. She seemed to like the attention and I got to learn about Craig’s work.

Craig and I are nearly the same age. He was born in 1959 and I in 1960. Our careers progressed along parallel lines. After he graduated he stayed at Duke and joined the faculty. I recall he told me at the time that he didn’t know if he would make a career in academia, but he certainly did. He was on the Duke faculty for 35 years. In the early 1990s three young researchers at Duke—Craig, Natalia Trayanova, and Wanda Krassowska—were all from my generation. They were my friends, collaborators, and sometimes competitors as we worked to establish the bidomain model as the state-of-the-art representation of the electrical properties of cardiac tissue.

In my recent review about bidomain modeling (Biophysics Reviews, Volume 2, Article 041301, 2021) , I wrote (referring to myself in third person, as required by the journal; in the quotes below references are removed):

Roth’s calculation was not the first attempt to solve the active bidomain model using a numerical method. In 1984, Barr and Plonsey had developed a preliminary algorithm to calculate action potential propagation in a sheet of cardiac tissue. Simultaneous with Roth’s work, Henriquez and Plonsey were examining propagation in a perfused strand of cardiac tissue. For the next several years, Henriquez continued to improve bidomain computational methods with his collaborators and students at Duke. His 1993 article published in Critical Reviews of Biomedical Engineering remains the definitive summary of the bidomain model.
I’ve cited his 1993 review article (Crit. Rev. Biomed. Eng., Volume 21, Pages 1–77) many times, including in Intermediate Physics for Medicine and Biology. It’s a classic.

Craig and I were both interested in determining if Madison Spach’s electrical potential data from cardiac tissue samples should be interpreted as evidence of discontinuous propagation (Spach’s hypothesis) or a bath effect.
The original calculations of action potential propagation in a continuous bidomain strand perfused by a bath hinted at different interpretations of Spach’s data. As discussed earlier, the wave front is not one-dimensional because its profile varies with depth below the strand surface. The same effect occurs during propagation through a perfused planar slab, more closely resembling Spach’s experiment. The conductivity of the bath is higher than the conductivity of the interstitial space, so the wave front propagates ahead on the surface of the tissue and drags along the wave front deeper below the surface, resulting in a curved front. The extra electrotonic load experienced at the surface slows the rate of rise and the time constant of the action potential foot. Plonsey, Henriquez, and Trayanova analyzed this effect, and subsequently so did Henriquez and his collaborators and Roth.

Craig became an associate editor of the IEEE Transactions on Biomedical Engineering, and he would often send me papers to review. He was a big college basketball fan. We would email each other around March, when our alma maters—my Kansas Jayhawks and his Duke Blue Devils—would face off in the NCAA tournament. His research interests turned to nerves and the brain, and he co-directed a Center of Neuroengineering at Duke. He eventually chaired Duke’s biomedical engineering department, and at the time of his death he was an Associate Vice Provost.

I found out about Craig’s death when I was submitting a paper to a journal. This publication asks authors to suggest potential reviewers, and I was about to put Craig’s name down as a person who would give an honest and constructive assessment. I googled him to get his current email address, and discovered the horrible news. What a pity. I will miss him. 

Short bio published in the IEEE Transactions on Biomedical Engineering in January, 1990.

 Craig Henriquez talking about cardiac tissue and the bidomain model.

https://www.youtube.com/watch?v=OiSiLwP1ZPo

Friday, January 19, 2024

The Alaska Airlines Boeing 737 Max Accident

Last week, the plug door panel on an Alaska Airlines Boeing 737 Max airplane detached during flight, leaving a gaping hole in the side of the fuselage. Fortunately, the plane was able to land safely and no one was seriously injured in the accident. I thought it would be fun to analyze this event from the point of view of physics in medicine and biology. Let me stress that I have no inside information about this accident, and I am not an aviation expert. I’m just an old physics professor playing around trying to make sense of information reported in the press.

Let’s calculate the pressure difference between the normal cabin pressure of a 737 Max and the outside air pressure. The typical pressure at sea level is 1 atmosphere, which is about 100,000 pascals. However, in most planes the cabin pressure is maintained somewhat lower than an atmosphere. Usually the cabin pressure corresponds to the air pressure at about 6000 feet, which is 1800 meters. The air pressure falls exponentially with height. Problem 42 in Chapter 3 of Intermediate Physics for Medicine and Biology asks the reader to calculate the length constant corresponding to this decay. If you solve that problem, you get a length constant of about 8700 meters. So, the cabin pressure in the plane should have been around exp(–1800/8700) = 0.81 atm before the door panel blew out.

The mid-air depressurization occurred at about 16,000 feet (4900 meters). I assume this means 16,000 feet above sea level. Therefore, the air pressure outside the plane just before the door panel failed was about exp(–4900/8700) = 0.57 atmosphere. Thus, the pressure difference between the inside and outside was approximately 0.81 – 0.57 = 0.24 atmospheres, or 24,000 pascals.

Otto von Guerick’s Magdeburg hemispheres experiment.
Otto von Guerick’s famous 
Magdeburg hemispheres experiment.

The door looks to me like it is about 5 feet by 3 feet, or 15 square feet, which is 1.4 square meters. So, the force acting on the door was (24,000 pascals)×(1.4 square meters) = 34,000 newtons, or 7600 pounds (almost 4 tons). That’s why it’s so important that the door panel be attached securely to the fuselage; air pressure differences can produce large forces, even if the pressure difference is only a quarter of an atmosphere. If you don’t believe me, just ask Otto von Guericke, who in 1654 showed how two hemispheres held together by air pressure could not be pulled apart by two teams of eight horses.

What sort of biological effects would a sudden drop of air pressure have? I expect the biggest effect would be on the ears. The eardrum separates the outside air from an air-filled region in the middle ear. Normally there’s no pressure difference across the ear drum, except for the tiny pressures associated with sound. But pop that door off the plane and you suddenly have a quarter atmosphere pressure difference. Some of the people on the plane complained of plugged ears following the accident. Your Eustachian tubes that connect your ears to your throat will eventually allow you to equilibrate the air pressure across the eardrum, but it may take a while, especially if you have a cold so your tubes are congested.

How significant is an abrupt change of 0.24 atmospheres? The Empire State Building is 1250 feet tall (380 meters), which means the top and bottom of the building have a pressure difference of only about 0.04 atm. If you hop on an express elevator and zoom to the observation deck at the top of the skyscraper, you won’t cry out in pain, but you might notice your ears pop. The cabin pressure in a plane typically falls from 1 atm to about 0.8 atm as the plane rises. That’s why our ears feel uncomfortable. But that change occurs slowly, so it is not too bothersome. Normal skydivers jump at about 10,000 feet (3000 meters), so during their descent they experience a drop in pressure of about 0.3 atm. Skydivers often experience noticeable ear pressure, but any associated pain is not severe enough to keep them from jumping again. Unfortunately, the pressure decompression on the 737 Max happened much more quickly than the decompression during a parachute jump, so I would expect any ear problems would have been greater for the passengers on the plane than for a typical skydiver.

Pressures under water are much greater than those in the air, because water is more dense than air. Dive into a pool to a depth of 32 feet (10 meters) and the pressure on your eardrum increases by one atmosphere. Swimmers typically have worse ear problems than airplane passengers. It is one reason why you have to use scuba equipment if you’re diving deep. It’s also why submarine accidents are so much more severe than airplane depressurizations. Remember last year when that submersible was going down to the wreckage of the Titanic and suffered the catastrophic implosion? It was going to a depth of 13,000 feet (4000 meters), which means the pressure difference between the inside and outside of the sub was about 400 atmospheres! You can survive a hole in the wall of a 737 Max, but not one in a Titanic-visiting submersible.

The airplane’s oxygen masks dropped when the hole opened in the 737 Max. Did people really need the oxygen? The airplane altitude was 16,000 feet when the accident occurred. Mount Everest is 29,000 feet high (8800 meters). A few people have climbed to the peak of Everest without using supplemental oxygen, but most carry an oxygen tank. The Everest base camp is 17,600 feet (5300 meters). Climbers often experience mild symptoms of altitude sickness at base camp, but for most it is not debilitating. I suspect that if the passengers on that 737 Max flight hadn’t put on their mask they would have survived, but it might have had an impact on their ability to think straight. And everyone is different; some are more susceptible to mild oxygen deprivation than others. Certainly, the safe thing to do was to put on the mask.

What would have happened if the door hadn’t blow out until the plane reached its cruising altitude of 35,000 feet (11,000 meters). Now you are well above the height of Mount Everest. The outside air pressure would be about 0.28 atmospheres. You would go unconscious (and probably die) if you didn’t promptly put on your mask. The pressure difference between the outside pressure and the cabin pressure would be over half an atmosphere. The odds of being sucked out of the plane during rapid decompression would have been higher. Yikes! The passengers on that 737 Max were lucky that door was very insecurely attached, and not just modestly insecurely attached. If you are going to have a in-flight disaster, it is best to have it as soon after takeoff as possible, before your altitude gets too high.
 
Physics With Illustrative Examples
From Medicine and Biology
.
by Benedek and Villars.
George Benedek and Felix Villars, in the first volume of their classic textbook Physics With Illustrative Examples From Medicine and Biology, discuss the effects of low oxygen.
Below 10,000 ft (3150) there is no detectable effect on performance and respiration and heart rates are unaffected. Between 10,000 and 15,000 ft (3150–4570 m) is a region of so-called "compensated hypoxia"... There is a measurable increase in heartbeat and breathing rate, but only a slight loss in efficiency in performing complex tasks. Between 15,000 and 20,000 ft (4570–6100 m), however, dramatic changes start to occur. The respiratory and heart rates increase markedly; there is a loss of critical judgment and muscular control, and a dulling of the senses. Emotional states can vary widely from lethargy to excitation with euphoria and even hallucinations... The final fatal regime is the altitude region from 20,000 to 25,000 ft (6100–7620 m).

Perhaps those few Mount Everest climbers who don’t carry an oxygen tank can only survive their ordeal by training their body to adapt to high altitudes.

Benedek and Villars also recount a fascinating story about oxygen deprivation from the early years of ballooning, based on an account written by Gaston Tissandier.

These various symptoms are shown very clearly in the tragic balloon ascent of the “Zenith” carrying the balloon pioneers Tissandier, Sivel, and Croce-Spinelli on April 15, 1875... The balloon’s maximum elevation as recorded on their instruments was 8600 m. Though gas bags containing 70% oxygen were carried by the balloonists, the rapid and insidious effect of hypoxia reduced their judgment and muscular control and prevented their use of the oxygen when it was most needed. Though these balloonists were indeed trying to establish an altitude record, their account shows clearly that their judgment was severely impaired during critical moments near the maximum tolerable altitudes. As they were on the verge of losing consciousness at 7450 m they decided to throw out the ballast and rise even higher. They lost consciousness above this altitude, but by good fortune the balloon descended rapidly after reaching 8600 m. On falling to about 6500 m the balloonists revived and—under the influence of the hypoxia did exactly the wrong thing once again—they threw out ballast! The second rise to high elevation killed Croce-Spinelli and Sivel.

Let us hope we have no more 737 Max door panels detaching in flight. I think we were lucky that no one was hurt this time. 
 
I’ll end with a 737 Max joke. What's the difference between the covid-19 virus and the 737 Max? Covid is airborne. (Rimshot).
 

 A video from inside the plane after the 737 Max door panel detached.

Friday, January 12, 2024

The First Log-Log Plot

In Chapter 2 of Intermediate Physics for Medicine and Biology, Russ Hobbie and I discuss log-log plots. Have you ever wondered who made the first log-log plot? The honor goes to French mathematician and engineer Léon Lalanne (1811–1892), who was interested in using infographics to aid in computation. Let me take you through his idea.

Start with a sheet of log-log graph paper, one cycle in each direction. 

A sheet of log-log graph paper, one cycle in each direction.

The lines in the bottom left are far apart, so let’s add a few more so it’s easier to make accurate estimates. 

A sheet of log-log graph paper, one cycle in each direction, with added lines.

Next, following Lalanne, add a bunch of diagonal lines connecting points of equal value on the vertical and horizontal axes. Label them, so they’re easy to read. 

A multiplication table, created using log-log graph paper.

What we’ve just invented is a log-log plot to do multiplication. For example, suppose we want to multiply 3.2 by 6.8. We find the value of 3.2 on the vertical axis, and draw a horizontal line (solid red). Then we find 6.8 on the horizontal axis and draw a vertical line (dashed red). Where the two lines intersect gives the product. We estimate it by seeing what are the closest diagonal lines. The intersection is between 20 and 22.5. I would guess it’s a little closer to 22.5 than 20, so I’ll estimate the product as 22.0. I’m pretty confident that I have the result correct to within ± 0.5. If I do the calculation on an electronic calculator, I get 21.76. My answer is off by 1.1%. Not bad.

An example using a multiplication table, created using log-log graph paper.

You can do other sorts of calculations with this one sheet of log-log paper. For instance, below I plot a green line with a slope of one half, which lets me calculate square roots. Really, this is just a plot of y = x1/2 on log-log paper. Because my log-log plot is only one cycle in each direction, the green line lets me calculate square roots of the numbers one through ten. To get the roots of ten through one hundred, I need to add a second, parallel line (green dashed). 

A square root calculator, created using log-log graph paper.


To calculate the square root of 77, I find 7.7 on the horizontal axis, go up to the dashed line, and then extrapolate over to the vertical axis. I estimate the result is about 8.8. When I use my electronic calculator, I get 8.775, so my estimate was accurate to about 0.3%. 

An example using a square root calculator, created using log-log graph paper.


Of course, you could do all sorts of other calculations. Lalanne included many in his “universal calculator” that he had printed and posted in public places. Basically, the universal calculator is meant to compete with the slide rule (see my discussion of IPMB and the slide rule here). His charts never were as popular as the slide rule, perhaps because it’s more fun to slide the little rules than it is to look at a busy chart.


Léon Lalanne’s“Universal Calculator,” or “Abacus” (1843).
Léon Lalanne’s “Universal Calculator,”
or “Abacus” (1843).

Friday, January 5, 2024

Basic Rheology for Biologists

Cell Mechanics.
In Chapter 1 of Intermediate Physics for Medicine and Biology, Russ Hobbie and I discuss ideal solids and ideal liquids. Ideal solids are covered in Section 1.10, which introduces stress, strain, and their relationship through an elastic modulus. Ideal fluids are discussed in Section 1.16, which introduces a Newtonian fluid where the shear force is related to the flow rate by the coefficient of viscosity.

In the book Cell Mechanics, the chapter “Basic Rheology for Biologists,” by Paul Janmey, Penelope Georges, and Søren Hvidt, focuses on materials that are not ideal solids or liquids.
Real materials are neither ideal solids nor ideal liquids nor even ideal mixtures of the two. There are always effects due to molecular rearrangements and other factors that complicate deformation, transforming elastic and viscous constants to functions of time, and extent of deformation. Real materials, and especially biological materials, exhibit both elastic and viscous responses and are therefore called viscoelastic. They are also often highly anisotropic, showing different viscoelastic properties when deformed in one direction than when deformed in other directions. The goal of rheological experiments is to quantify the viscoelasticity of a material over as wide a range of time and deformation scales as possible, and ultimately to relate these viscoelastic properties to the molecular structure of the material.
IPMB examines only briefly the subject of rheology: the study of how nonideal materials deform and flow.
In some materials, the stress depends not only on the strain, but on the rate at which the strain is produced. It may take more stress to stretch the material rapidly than to stretch it slowly, and more stress to stretch it than to maintain a fixed strain. Such materials are called viscoelastic.

Some materials are even more complicated, and the stress is not proportional to the strain or flow, but instead the relationship is nonlinear, demonstrating strain softening or strain stiffening.

Most materials will exhibit strain softening with a smaller [elastic modulus] at large strains. However, some systems exhibit strain stiffening where [the elastic modulus] increases above a critical strain.

Russ and I show an example of strain softening in IPMB’s Fig. 1.21. When stress is plotted versus strain, the stress first rises linearly and then bends over and becomes flatter. 

One rheological concept Russ and I never discuss is creep. Janmey et al. write

Many biological systems experience a sustained force such as gravity or blood pressure. It is therefore useful to monitor how such systems deform under a constant load or stress. This type of measurement is called a creep experiment, and in such an experiment the strain is monitored as a function of time for a fixed stress.

A creep-recovery experiment.

Another type of stress-relaxation experiment is to keep the strain constant and measure the stress.
Stress–relaxation measurements can be performed in both simple shear and simple elongation, and they are of special interest for viscoelastic systems. In a stress–relaxation experiment, the sample is rapidly deformed and the stress is monitored as a function of time, keeping the sample in the deformed state.
A stress-relaxation experiment.

Janmey et al. point out that oscillatory behavior is particularly useful when studying nonideal materials.
Rheological information for viscoelastic systems is often obtained by applying small amplitude oscillatory strains or stresses to the sample rather than steady flows.
When a oscillating deformation is applied to a material, the part of the stress in phase with the strain contains information about the material’s elastic behavior and the out-of-phase part contains information about the viscosity. 

Rheology is an advanced topic and probably doesn't belong in an intermediate textbook like IPMB. Yet, in the messy, wet, and sticky world of biology, rheology can often play a major role. Janmey et al. conclude
As cell and tissue mechanics become more of an integral part of basic cell biologic studies, a comprehensive understanding of micro- and macrorheology may help develop a unified model for how specific structural elements are used to form the soft but durable and adaptable materials that make up most organisms. The results of these studies also have potential for developing materials and methods for wound healing, cell differentiation, artificial organ development, and many other applications in biomedical research.

Friday, December 29, 2023

Special Relativity in IPMB

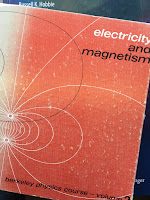
Electricity and Magnetism, by Edward Purcell, superimposed on Intermediate Physics for Medicine and Biology.
Electricity and Magnetism,
by Edward Purcell.
In Intermediate Physics for Medicine and Biology, Russ Hobbie and I rarely discuss special relativity. We briefly mention that magnetism is a consequence of relativity in Chapter 8 (Biomagnetism) but we don’t develop our study of magnetic fields from this point of view. (If you want to see magnetism analyzed in this way, I suggest looking at the textbook Electricity and Magnetism, by Edward Purcell, which is Volume 2 of the Berkeley Physics Course). We use the relationship between the energy and momentum of a photon, E = pc, in Chapter 15 (Interaction of Photons and Charged Particles with Matter) when analyzing Compton scattering and pair production. And we use Einstein’s famous equation E = mc2, relating a particles energy to its rest mass, when calculating the binding energy of nuclei in Chapter 17 (Nuclear Physics and Nuclear Medicine).

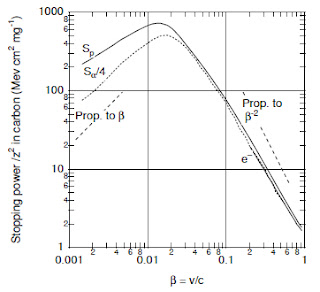
The most relativisticish equation we present is in Chapter 15 when analyzing how charged particles (such as protons, electrons, or alpha particles) lose energy when passing through tissue at relativistic speeds. We write

The stopping powers are plotted vs particle speed in the form β = v/c. At low energies (β ≪ 1) Î² is related to kinetic energy by 


For larger values of Î², the relativistically correct expression

was used to convert Fig. 15.17 to 15.18. 

Fig. 15.17


Fig. 15.18

Here’s a new homework problem examining the relationship between a particle’s speed and kinetic energy when its speed is near the speed of light.

Section 15.11

Problem 41 ½. A charged particle’s kinetic energy, T, is related to its mass M and its speed, v. We often express speed in terms of the parameter Î² = v/c, where c is the speed of light.

(a) At low energies (TMc2, or equivalently Î² ≪ 1), show that Eq. 15.47 is consistent with the familiar expression from classical mechanics, T = ½ mv2.

(b) Show that Equation 15.48 (the relativistically correct relationship between Î² and T) reduces to Eq. 15.47 when TMc2.

(c) Plot Î² versus T/Mc2, both in a linear plot (0 < T/Mc2 < 3) and in a log-log plot (0.0001 < T/Mc2 < 100).

(d) Take a few data points from Fig. 15.17 for a proton, replot them in Fig. 15.18, where the dependent variable is Î², not T. See how well they match. Be sure to adjust for the different units for Stopping Power in the two plots.