Friday, September 16, 2022

Drawdown

Drawdown, Edited by Paul Hawken, superimposed on Intermediate Physics for Medicine and Biology.
Drawdown,
Edited by Paul Hawken.
This blog is about physics applied to medicine and biology, but if we don’t solve the climate crisis there’s no use developing fancier ways to do medical imaging or radiation therapy; we’ll all be dead. So today I’m going to tell you about a book I just read, titled Drawdown: The Most Comprehensive Plan Ever Proposed to Reverse Global Warming. It’s the book I’ve been looking for. It analyzes all the different ways we can address global warming, and ranks them by impact and importance. Here’s how the editor Paul Hawken begins Drawdown.
The genesis of Project Drawdown was curiosity, not fear. In 2001 I began asking experts in climate and environmental fields a question: Do we know what we need to do in order to arrest and reverse global warming? I thought they could provide a shopping list. I wanted to know the most effective solutions that were already in place, and the impact they could have if scaled. I also wanted to know the price tag. My contacts replied that such an inventory did not exist, but all agreed it would be a great checklist to have, though creating one was not within their individual expertise. After several years, I stopped asking because it was not within my expertise either.

Then came 2013. Several articles were published that were so alarming that one began to hear whispers of the unthinkable: It was game over. But was that true, or might it possibly be game on? Where did we actually stand? It was then that I decided to create Project Drawdown. In atmospheric terms drawdown is that point in time at which greenhouse gases peak and begin to decline on a year-to-year basis. I decided that the goal of the project would be to identify, measure, and model one hundred substantive solutions to determine how much we could accomplish within three decades towards that end.
Many solutions are presented in Drawdown, but here I count down the top ten, ranked according to their total atmospheric carbon dioxide reduction, with a brief quote from Drawdown accompanying each.

10. Rooftop Solar

As households adopt rooftop solar… they transform generation [of electricity] and its ownership, shifting away from utility monopolies and making power production their own.

9. Silvopasture

Silvopasture is… the integration of trees and pasture or forage into a single system for raising livestock… Trees create cooler microclimates and more protective environments, and can moderate water availability. Therein lies the climatic win-win of silvopasture: As it averts further greenhouse emissions from one of the world’s most polluting sectors, it also protects against changes that are now inevitable.

8. Solar Farms

Any scenario for reversing global warming includes a massive ramp-up of solar power by mid-century. It simply makes sense: the sun shines every day, providing a virtually unlimited, clean, and free fuel at a price that never changes. Small, distributed clusters of rooftop panels are the most conspicuous evidence of the renewables revolution powered by solar photovoltaics (PV). The other, less obvious iteration of the PV phenomenon is large-scale arrays of hundreds, thousands, or in some cases millions of panels [solar farms] that achieve generating capacity in the tens or hundreds of megawatts.

7. Family Planning

Increased adoption of reproductive healthcare and family planning is an essential component to achieve the United Nations’ 2015 medium global population projection of 9.7 billion people by 2050. If investment in family planning, particularly in low-income countries, does not materialize, the world’s population could come closer to the high projection, adding another 1 billion people to the planet.

6. Educating Girls

Girls education, it turns out, has a dramatic bearing on global warming. Women with more years of education have fewer, healthier children and actively manage their reproductive health… Synchronizing investments in girls’ education with those in family planning would be complementary and mutually reinforcing. Education is grounded in the belief that every life bubbles with innate potential. When it comes to climate change, nurturing the promise of each girl can shape the future for all.

5. Tropical Forests

In recent decades, tropical forests... have suffered extensive clearing, fragmentation, degradation, and depletion of flora and fauna… One of the dominant storylines of the nineteenth and twentieth centuries was the vast loss of forestland. Its restoration and re-wilding could be the twenty-first-century story.

4. Plant-Rich Diet

Eat food. Not too much. Mostly plants.

3. Reduced Food Waste

Whether on the farm, near the fork, or somewhere in between, efforts to reduce food waste can address emissions and ease pressure on resources of all kinds, while enabling society more effectively to supply future food demand.

2. Wind Turbines

Ongoing cost reduction will soon make wind energy the least expensive source of installed electricity capacity, perhaps within a decade.

1. Refrigerant Management

As temperatures rise, so does reliance on air conditioners. The use of refrigerators, in kitchens of all sizes and throughout “cold chains” of food production and supply, is seeing similar expansion. As technologies for cooling proliferate, evolution in refrigerants and their management is imperative.

While reading Intermediate Physics for Medicine and Biology, let’s turn up the thermostat a bit during warm days. Between chapters, let’s ditch the hamburger and eat a salad instead (and if you can’t finish it, save the rest for leftovers). Let’s make sure girls in particular are encouraged to read IPMB (or whatever else that will help with their education). And let’s write our congressional representatives and encourage them to support solar and wind energy sources.

If you don’t have the time to read Drawdown, or don’t have easy access to it, then visit the website drawdown.org or watch the videos below, which summarize the plan to reverse global warming.

Climate Solutions 101. Unit 1, Setting the Stage

https://www.youtube.com/watch?v=qT_O2F5zgXc&list=PLwYnpej4pQF7UPnt0nkZEa8sxR9TmWR1B&index=1

Climate Solutions 101. Unit 2, Stopping Climate Change 

https://www.youtube.com/watch?v=bkDherHOymo&list=PLwYnpej4pQF7UPnt0nkZEa8sxR9TmWR1B&index=2

Climate Solutions 101. Unit 3, Reducing Sources 

https://www.youtube.com/watch?v=EiE2DbUOmgc&list=PLwYnpej4pQF7UPnt0nkZEa8sxR9TmWR1B&index=3 


Climate Solutions 101. Unit 4, Supporting Sinks and Improving Society

Friday, September 9, 2022

An Immense World

“Earth teems with sights and textures, sounds and vibrations, smells and tastes, electric and magnetic fields. But every animal can only tap into a small fraction of reality’s fullness. Each is enclosed within its own unique sensory bubble, perceiving but a tiny sliver of our immense world.”
An Immense World, by Ed Yong, superimposed on Intermediate Physics for Medicine and Biology.
An Immense World,
by Ed Yong.
Those three sentences sum up Ed Yong’s new book An Immense World: How Animal Senses Reveal the Hidden Realms Around Us. Yong is a science writer for The Atlantic who won a Pulitzer Prize for his reporting about the COVID-19 pandemic. I’ve mentioned Yong in this blog before when quoting advice from his chapter in the book Science Blogging: “you have to have something worth writing about, and you have to write it well.” In An Immense World, Yong does both.

An Immense World sometimes overlaps with Intermediate Physics for Medicine and Biology. For example, both books discuss vision. Yong points out the human eye has better visual acuity than most other animals. He writes “we assume that if we can see it, they [other animals] can, and that if it’s eye-catching to us, it’s grabbing their attention… That’s not the case.” Throughout his book, Yong returns to this idea of how sensory perception differs among animals, and how misleading it can be for us to interpret animal perceptions from our own point of view.

Like IPMB, An Immense World examines color vision. Yong speculates about what a bee would think of the color red, if bees could think like humans.
Imagine what a bee might say. They are trichromats, with opsins that are most sensitive to green, blue, and ultraviolet. If bees were scientists, they might marvel at the color we know as red, which they cannot see and which they might call “ultrayellow” [I would have thought “infrayellow”]. They might assert at first that other creatures can’t see ultrayellow, and then later wonder why so many do. They might ask if it is special. They might photograph roses through ultrayellow cameras and rhapsodize about how different they look. They might wonder whether the large bipedal animals that see this color exchange secret messages through their flushed cheeks. They might eventually realize that it is just another color, special mainly in its absence from their vision.
Both An Immense World and IPMB also analyze hearing. Yong says
Human hearing typically bottoms out at around 20 Hz. Below those frequencies, sounds are known as infrasound, and they’re mostly inaudible to us unless they’re very loud. Infrasounds can travel over incredibly long distances, especially in water. Knowing that fin whales also produce infrasound, [scientist Roger] Payne calculated, to his shock, that their calls could conceivably travel for 13,000 miles. No ocean is that wide.…

Like infrasound, the term ultrasound… refers to sound waves with frequencies higher than 20 kHz, which marks the upper limit of the average human ear. It seems special—ultra, even—because we can’t hear it. But the vast majority of mammals actually hear very well into that range, and it’s likely that the ancestors of our group did, too. Even our closest relatives, chimpanzees, can hear close to 30 kHz. A dog can hear 45 kHz; a cat, 85 kHz; a mouse, 100 kHz; and a bottlenose dolphin, 150 kHz. For all of these creatures, ultrasound is just sound.
In IPMB, Russ Hobbie and I introduce the decibel scale for measuring sound intensity, or how loud a sound is. Yong uses this concept when discussing bats.
The sonar call of the big brown bat can leave its mouth at 138 decibels—roughly as loud as a siren or jet engine. Even the so-called whispering bats, which are meant to be quiet, will emit 110-decibel shrieks, comparable to chainsaws and leaf blowers. These are among the loudest sounds of any land animal, and it’s a huge mercy that they’re too high-pitched for us to hear.

Yong examines senses that Russ and I never consider, such as smell, taste, surface vibrations, contact, and flow. He wonders about the relative value of nociception [a reflex action to avoid a noxious stimulus] and the sensation of pain [a subjective feeling created by the brain].

The evolutionary benefit of nociception is abundantly clear. It’s an alarm system that allows animals to detect things that might harm or kill them, and take steps to protect themselves. But the origin of pain, on top of that, is less obvious. What is the adaptive value of suffering?

On the continuum ranging from life’s unity to diversity, Yong excels at celebrating the diverse, while Russ and I focus on how physics reveals unifying principles. I’m sometimes frustrated that Yong doesn’t delve into the physics of these topics more, but I am in awe of how he highlights so many strange and wonderful animals. There’s a saying that “nothing in biology makes sense except in light of evolution.” That’s true for An Immense World, which is a survey of how the evolution of sensory perception shapes they way animals interact, mate, hunt their prey, and avoid their predators.

Two chapters of An Immense World I found especially interesting were about sensing electric and magnetic fields. When discussing the black ghost knifefish’s ability to sense electric fields, Yong writes

Just as sighted people create images of the world from patterns of light shining onto their retinas, an electric fish creates electric images of its surroundings from patterns of voltage dancing across its skin. Conductors shine brightly upon it. Insulators cast electric shadows.
Then he notes that
Fish use electric fields not just to sense their environment but also to communicate. They court mates, claim territory, and settle fights with electric signals in the same way other animals might use colors or songs.
Even bees can detect electric fields. For instance, the 100 V/m electric field that exists at the earth’s surface can be sensed by bees.
Although flowers are negatively charged, they grow into the positively charged air. Their very presence greatly strengthens the electric fields around them, and this effect is especially pronounced at points and edges, like leaf tips, petal rims, stigmas, and anthers. Based on its shape and size, every flower is surrounded by its own distinctive electric field. As [scientist Daniel] Robert pondered these fields, “suddenly the question came: Do bees know about this?” he recalls. “And the answer was yes.”
The chapter on sensing magnetic fields is different from the others, because we don’t yet know how animals sense these fields.
Magnetoreception research has been polluted by fierce rivalries and confusing errors, and the sense itself is famously difficult both to study and to comprehend. There are open questions about all the senses, but at least with vision, smell, or even electroreception, researchers know roughly how they work and which sense organs are involved. Neither is true for magnetoreception. It remains the sense that we know least about, even though its existence was confirmed decades ago.

Yong lists three possible mechanisms for magnetoreception: 1) magnetite, 2) electromagnetic induction, and 3) magnetic effects on radical pairs. Russ and I discuss the first two in IPMB. I get the impression that the third is Yong’s favorite, but I remain skeptical. In my book Are Electromagnetic Fields Making Me Ill? I say that “they jury is still out” on the radical pair hypothesis.

If you want to read a beautifully written book that explores how much of the physics in Intermediate Physics for Medicine and Biology can be used by species throughout the animal kingdom to sense their environment, I recommend An Immense World. You’ll love it.

 Umwelt: The hidden sensory world of animals. By Ed Yong.

https://www.youtube.com/watch?v=Pzsjw-i6PNc


 Ed Yong on An Immense World

https://www.youtube.com/watch?v=bQS0Ioch05E

Friday, September 2, 2022

Numerical Integration

A homework problem in Chapter 14 of Intermediate Physics for Medicine and Biology states
Problem 28. Integrate Eq. 14.33 over all wavelengths to obtain the Stefan-Boltzmann law, Eq. 14.34. You will need the integral
An integral from Homework Problem 28 in Intermediate Physics for Medicine and Biology.
Equation 14.33 is Planck’s blackbody radiation law and Eq. 14.34 specifies that the total power emitted by a blackbody.

Suppose Russ Hobbie and I had not given you that integral. What would you do? Previously in this blog I explained how the integral can be evaluated analytically and perhaps you’re skilled enough to perform that analysis yourself. But it’s complicated, and I doubt most scientists could do it. If you couldn’t, what then?

You could integrate numerically. Your goal is to find the area under the curve shown below.
A plot of the function to be integrated, as a function of x.
Unfortunately x ranges from zero to infinity (the plot shows the function up to only x = 10). You can’t extend x all the way to infinity in a numerical calculation, so you must either truncate the definite integral at some large value of x or use a trick.

A good trick is to make a change of variable, such as
When x equals zero, t is also zero; when x equals infinity, t is one. The integral becomes
The integral from the homework problem, expressed in terms of t rather than x.
Although this integral looks messier than the original one, it’s actually easier to evaluate because the range of t is finite: zero to one. The integrand now looks like this: 

A plot of the function to be integrated, as a function of t. 
The colored stars in these two plots are to guide the reader’s eye to corresponding points. The blue star at t = 1 is not shown in the first plot because it corresponds to x = ∞.

We can evaluate this integral using the trapezoid rule. We divide the range of t into N subregions, each extending over a length of Δt = 1/N. Ordinarily, we have to be careful dealing with the two endpoints at t = 0 and 1, but in this case the function we are integrating goes to zero at the endpoints and therefore contributes nothing to the sum. The approximation is shown below for N = 4, 8, and 16. 

Plots of three different approximations of the integral, for N=4, 8, and 16.
 
The area of the purple rectangles approximates the area under the red curve This approximation gets better as N gets bigger. In the limit as N goes to ∞, you get the integral.

I performed the calculation using the software Octave (a free version of Matlab). The program is:
N=8; 
dt=1/N; 
s=0; 
for i=1:N-1 
     t=i*dt; 
     s=s+dt*t^3/((exp(t/(1-t))-1)*(1-t)^5); 
     endfor
I found the results shown below. The error is the difference between the numerical integration and the exact result (π4/15 = 6.4939…), divided by the exact result, and expressed as a percent difference.

   N    I % error
    2    1.1640    –82
    4    6.2823      –3.26
    8    6.6911        3.04
  16    6.5055        0.178
  32    6.4940        0.000282
  64    6.4939        0.00000235
128    6.4939        0.00000000174

These results show that you can evaluate the integral accurately without too much effort. You could even imagine doing this by hand if you didn’t have access to a computer—using, say, N = 16—and getting an answer accurate to better than two parts per thousand.

For many purposes, a numerical solution such as this one is adequate. However, 6.4939… doesn’t look as pretty as π4/15. I wonder how many people could calculate 6.4939 and then say “Hey, I know that number; It’s π4/15”!

Friday, August 26, 2022

Transcranial Magnetic Stimulation

When I was at the National Institutes of Health in the early 1990s, I worked on transcranial magnetic stimulation of the brain. In Chapter 8 of Intermediate Physics for Medicine and Biology, Russ Hobbie and I describe this technique.
8.7 Magnetic Stimulation 
Since a changing magnetic field generates an induced electric field, it is possible to stimulate nerve or muscle cells without using electrodes. The advantage is that for a given induced current deep within the brain, the currents in the scalp that are induced by the magnetic field are far less than the currents that would be required for electrical stimulation. Therefore transcranial magnetic stimulation (TMS) is relatively painless...

One of the earliest investigations was reported by Barker, Jalinous and Freeston (1985). They used a solenoid in which the magnetic field changed by 2 T in 110 μs to apply a stimulus to different points on a subject’s arm and skull. The stimulus made a subject’s finger twitch after the delay required for the nerve impulse to travel to the muscle.

The story of how Tony Barker invented transcranial magnetic stimulation is fascinating. You can hear about it in the video below, where John Rothwell—another early magnetic stimulation researcher—reminisces with Barker about his invention. The most interesting part of the video is when Barker describes a crucial trip he made from Sheffield (he worked at the Royal Hallamshire Hospital in Sheffield, England) to London (The National Hospital, Queen’s Square), so he could demonstrate his device to leading neurophysiologist Pat Merton. Rothwell, also at Queen’s Square, had his brain stimulated that day, and the next day he wrote Barker asking to get a stimulator of his own. Barker’s 1985 paper in The Lancet (cited in IPMB) was the first publication about magnetic stimulation of the brain. As Barker says, “like all the best papers it was one page long.”

The 15-minute video is well worth your time. I’ll stop writing so you can listen. Enjoy!

Anthony Barker reminiscing with John Rothwell about the invention of transcranial magnetic stimulation.

https://www.youtube.com/watch?v=1DI3EC2pQ44

Friday, August 19, 2022

The Loudest Sound

In Table 13.1 of Intermediate Physics for Medicine and Biology, Russ Hobbie and I list the approximate intensity levels of various sounds, in decibels. The minimum perceptible sound is 0 dB, a typical office has a sound level of 50 dB, a jack hammer is 100 dB, and the loudest sound listed is a rocket launch pad at 170 dB.

Can there be even louder sounds? Yes, there can! This new homework problem lets you calculate the loudest possible sound.
Section 13.4

Problem 17 ½. Let us calculate the loudest possible sound in air. 
(a) Use Eq. 13.29 to calculate the intensity of a sound in W m−2, using 428 Pa s m−1 for the acoustic impedance of air and one atmosphere (1.01 × 10⁵ Pa) for the pressure. This pressure is the largest that can exist for a sinusoidally varying sound wave, as an even louder sound would create a minimum pressure below zero (less than a vacuum). 
(b) Use the result from part (a) to calculate the intensity in decibels using Eq. 13.34.
For those of you who don’t have a copy of IPMB at your side, here are the two equations you need

                I = ½ p2/Z                                         (13.29)

                Intensity level = 10 log10(I/I0)         (13.34)

where I is the intensity, Z is the acoustic impedance, p is the pressure, I0 is the minimum perceptible intensity (10−12 W m−2), and log10 is the common logarithm.

I’ll let you do the calculation, but you should find that the loudest sound is about 191 dB. Is this really an upper limit? No, you could have a peak pressure larger than one atmosphere, but in that case you wouldn’t be dealing with a traditional sound wave (with pressure ranging symmetrically above and below the ambient pressure) but more of a nonlinear acoustic shock wave.

Krakatoa, by Simon Winchester, superimposed on Intermediate Physics for Medicine and Biology.
Krakatoa,
by Simon Winchester.
Has there ever been a sound that loud? Or, more interestingly, what is the loudest sound ever heard on earth? That’s hard to say for sure, but one possibility is the 1883 eruption of the Krakatoa volcano. We know this sound was loud, because people heard it so far from where the eruption occurred.

Simon Winchester tells this story in his fascinating book Krakatoa: The Day the World Exploded, August 27. 1883. Krakatoa is an island that is now part of Indonesia. When it erupted, people on the island of Rodriguez in the western Indian Ocean, nearly 3000 miles from Krakatoa, could hear it. Winchester writes
In August 1883 the chief of police on Rodriguez was a man named James Wallis, and in his official report… for the month he noted:
On Sunday the 26th the weather was stormy, with heavy rain and squalls; the wind was from SE, blowing with a force of 7 to 10, Beaufort scale. Several times during the night (26th–27th) reports were heard coming from the eastward, like the distant roar of heavy guns. These reports continued at intervals of between three and four hours, until 3 pm on the 27th, and the last two were heard in the directions of Oyster Bay and Port Mathurie [sic].
This was not the roar of heavy guns, however. It was the sound of Krakatoa—busily destroying itself fully 2,968 miles away to the east. By hearing it that night and day, and by noting it down as any good public servant should, Chief Wallis was unknowingly making for himself two quite separate entries in the record books of the future. For Rodriguez Island was the place furthest from Krakatoa where its eruptions could be clearly heard. And the 2,968-mile span that separates Krakatoa and Rodriguez remains to this day the most prodigious distance recorded between the place where unamplified and electrically unenhanced natural sound was heard and the place where that same sound originated.
Winchester concludes
The sound that was generated by the explosion of Krakatoa was enormous, almost certainly the greatest sound ever experienced by man on the face of the earth. No manmade explosion, certainly, can begin to rival the sound of Krakatoa—not even those made at the height of the Cold War’s atomic testing years.

No one knows how many decibels Krakatoa’s eruption caused on the island itself. The sound was almost certainly in the nonlinear regime, and probably had an intensity of over 200 dB.

An Interview with Simon Winchester. 

https://www.youtube.com/watch?v=MGNLJb1m2fg


Friday, August 12, 2022

Scientist: E. O. Wilson: A Life in Nature

Scientist: E. O. Wilson: A Life in Nature,
by Richard Rhodes.
I often become interested in the writing of a particular author and read several of that author’s books consecutively. Recently, I’ve become obsessed with Richard Rhodes. Last week in this blog, I discussed his 2018 book Energy: A Human History. Today I analyze his more recent (2021) biography Scientist: E. O. Wilson: A Life in Nature. I’ve discussed Wilson—who died late last year at the age of 92—previously in this blog, examining his book Letters to a Young Scientist and his Encyclopedia of Life (eol.org).

I was particularly fascinated by Rhodes’s tale of Wilson and James Watson as competing assistant professors at Harvard in the late 1950s. Watson advocated for molecular biology, while Wilson favored evolutionary biology. It was a battle between the unity and diversity of life. Wilson, with a job offer from Stanford in hand, was offered tenure if he would remain at Harvard. Watson—already famous for discovering the structure of DNA with Francis Crick—was livid that Wilson was to be tenured before he was. In the end, Harvard gave them both tenure (a wise decision). Decades later Wilson and Watson become friends. Listen to them discuss their rivalry in the video at the end of this post.

Readers of Intermediate Physics for Medicine and Biology will be interested in Wilson’s online high-school biology textbook Life on Earth. Physicists, mathematicians, and engineers who want to apply their field to biology or medicine always face the obstacle of learning biology. Sometimes they don’t need a deep knowledge of biology, but merely must know enough to collaborate with a biologist. Life on Earth is an excellent introduction to the field. It is free, available online, is written by a giant in the field of biology, and contains beautiful photographs and engaging videos. The only problem: it was written to be used on a Mac. I am a Mac guy, so this is not a problem for me. I don’t know if it works on a PC. Life on Earth should provide you with enough biology to understand IPMB.

Other books by Richard Rhodes that I liked are The Making of the Atomic Bomb (in my opinion the best history of science book ever written) and Hedy's Folly (about the amazing life of Hedy Lamarr: Actress, World War II pin-up girl, and inventor of a frequency-hopping algorithm to prevent the jamming of radio-controlled torpedoes). What's next? Rhodes’s biography of John James Audubon.

Looking Back Looking Forward: A Conversation with James D. Watson and Edward O. Wilson.
 
 
E. O. Wilson’s Life on Earth.
 
 
Life on Earth, by E. O. Wilson.


Friday, August 5, 2022

Energy: A Human History

In Chapter 2 of Intermediate Physics for Medicine and Biology, Russ Hobbie and I have an end-of-chapter homework problem about consuming a finite resource.
Section 2.10 
Problem 37. The consumption of a finite resource is often modeled using the logistic equation. Let y(t) be the cumulative amount of a resource consumed and y be the total amount that was initially available at t = −∞. Model the rate of consumption [I wish Russ and I had written “amount consumed” instead of “rate of consumption”] using Eq. 2.29 over the range −∞ < t < ∞. 
(a) Set y0 = y/2, so that the zero of the time axis corresponds to when half the resource has been used. Show that this simplifies Eq. 2.29. 
(b) Differentiate y(t) to find an expression for the rate of consumption. Sketch plots of dy/dt versus t on linear and semilog graph paper. When does the peak rate of consumption occur? 
When this model is applied to world oil consumption, the maximum is called Hubbert’s peak (Deffeyes 2008).
The answer to this exercise can be found in the IPMB solution manual. (The solution manual is available free of charge to instructors. If you need a copy, email me at roth@oakland.edu.) All exercises in the solution manual have a brief preamble, explaining the goal of the exercise and why it’s important.
2.37This is not a biological example, except in the sense that if we ignore this example we humans may all end up dead. Students use a variation of the logistic equation to analyze the consumption of a finite resource (e.g., oil).

I won’t solve the entire problem in this blog post, but I will show the semilog plot from the solution manual.

A semilog plot of amount consumed (solid) and the rate of consumption (dashed) for a finite resource modeled using the logistic equation. This plot is part of the solution to Problem 37b.

    
Energy: A Human History,
by Richard Rhodes.

The rate of consumption of the resource (dy/dt) first rises exponentially, reaches a peak, and then falls exponentially. (Remember, a straight line on a semilog plot corresponds to exponential growth or decay.) For the mathematically inclined, the dy/dt curve corresponds to a hyperbolic secant squared.

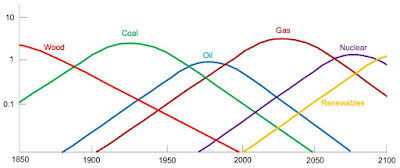
Why do I bring up this topic? Recently I read Energy: A Human History, by Richard Rhodes, a sweeping account of energy transitions that changed our world. Rhodes includes a figure that looks a little bit like this: 

My rendition of a figure from the final chapter of Energy: A Human History, by Richard Rhodes, showing the historical evolution of the world energy mix.
My rendition of a figure from the final chapter of Energy: A Human History showing the historical evolution of the world energy mix.
What a wonderful plot! It both summarizes Rhodes’s book and illustrates the power and ubiquity of Hubbert’s peak. That semilog plot from Homework Problem 37 appears over and over as one finite resource replaces another.

I should add a few qualifiers.

  • Historical data is noisy and the curves pictured above merely approximate a complicated behavior. 
  • The plot begins at about the time of the industrial revolution. The population of humans was probably too small, and our technology too primitive, to apply this model before that time. 
  • All future data (say, after 2016, the year Energy was published) is extrapolation or prediction. 
  • I labeled the yellow curve on the right “Renewables” but it really represents whatever comes next, be it wind, solar, hydroelectric, geothermal, or even nuclear fusion
  • Let’s hope that the Renewables curve corresponds to an infinite resource, not a finite one, so it will never reach a peak and then fall. Is that wishful thinking? I don’t know, but the figure encourages us to ask such questions. 
  • Nuclear energy shot up much faster than would be expected right after World War II, but then the curve flattened prematurely because of fears about radiation
  • Natural gas appears to be with us for the foreseeable future, unless we can wean ourselves off of it to address global warming. The use of coal is almost done (regardless of what a certain senator from West Virginia thinks), and the use of oil has reached its peak and is on its way down (now might be a good time to buy an electric car). 
  • Climate change is the critical issue looming over the right side of the plot. We must leave many of those fossil fuels (coal, oil, gas) in the ground to prevent an environmental disaster.

Perhaps I need to add extra parts to that homework problem.

(c) Suppose at time t you discover that pollution from this finite resource is killing people, and you stop consuming it immediately. How would that change the plots you made in part (b)? 
(d) What would happen if the resource is killing people but people continue to consume it nevertheless?

 Richard Rhodes, The Light of New Fires: Energy Transitions Yesterday and Today, presented at the American Museum of Science and Energy, Oak Ridge, Tennessee, October 22, 2015.

Friday, July 29, 2022

Essential Concepts in MRI

Essential Concepts in MRI, by Yang Xia, superimposed on Intermediate Physics for Medicine and Biology.
Essential Concepts in MRI,
by Yang Xia.
Suppose you’ve read Chapter 18 of Intermediate Physics for Medicine and Biology covering magnetic resonance imaging and you want to learn more. What do you read next? I suggest the new textbook by Yang Xia, Essential Concepts in MRI: Physics, Instrumentation, Spectroscopy, and Imaging. Xia writes in the Preface
In the fall of 1994, I became a new assistant professor of physics at Oakland University, in the specialization of medical physics. After receiving my assignment to teach a graduate-level one-semester course in magnetic resonance imaging (MRI) for the next semester, I sat in my nearly empty office and wondered what and how to teach my students…

As I went over [the MRI books available at the time] for a possible adaptation for my course, I could not find any single book that contained what I had in mind as the four essential and inseparable components of MRI—theory, instrumentation, spectroscopy, and imaging… I eventually realized, painfully, that I would have to put together the materials myself… My lecture notes, evolved and revised substantially during the last 26 years, became the basis for this book…

The book is grouped into five parts. Part I introduces the essential comcepts in magnetic resonance, including the use of the classical description and a brief introduction of the quantum mechanical description. It also includes the description for a number of nuclear interactions that are fundamental to magnetic resonance. Part II covers the essential concepts in experimental magnetic resonance, which are common for both NMR spectroscopy and MRI. Part III describes the essential concepts in NMR spectroscopy, which should also be beneficial for MRI researchers. Part IV introduces the essential concepts in MRI. The final part is concerned with the quantitative and creative nature of MRI research…

IPMB covers some of the material in Essential Concepts, particularly that dealing with physics and imaging. Nuclear magnetic resonance spectroscopy is entirely absent in IPMB. I had not seen the material in Essential Concepts about spectroscopy since taking an organic chemistry course while an undergraduate at the University of Kansas, and even then I didn’t understand much of it. IPMB has little to say about instrumentation and I found these sections of Essential Concepts to be among the most useful for me.

Essential Concepts is full of excellent images and illustrations. Some images, such as a high-resolution picture of a pickle, I had seen before on the door to Xia’s laboratory at Oakland University. We both were members of the physics department at OU for over twenty years. In fact, if you look at the acknowledgment section of Essential Concepts, you’ll find my name—along with many others—listed as reading and commenting on a draft of the book. Of course, this was done virtually, as Xia sat in his house and I in mine during the COVID-19 pandemic. This book is one of the few good things that arose from that plague.

The Early Development of Q-Space NMR Microscopy — Yang Xia

Friday, July 22, 2022

FLASH

In radiotherapy, a dose of radiation is usually not given all at once, but instead is applied in fractions. In Intermediate Physics for Medicine and Biology, Russ Hobbie and I discuss fractionation this way.
The central problem of radiation oncology is how much dose to give a patient, over what length of time, in order to have the greatest probability of killing the tumor while doing the least possible damage to surrounding normal tissue. While the dose is sometimes given all at once (over several minutes), it is usually given in fractions five days a week for four to six weeks.
Radiobiology for the Radiologist,
by Hall and Giaccia.
We can gain insight into why fractionation works from Eric Hall and Amato Giaccia’s book Radiobiology for the Radiologist.
The basis of fractionation in radiotherapy can be understood in simple terms. Dividing a dose into several fractions spares normal tissues because of repair of sublethal damage between dose fractions and repopulation of cells if the overall time is sufficiently long. At the same time, dividing a dose into several fractions increases damage to the tumor because of reoxygenation and reassortment of cells into radiosensitive phases of the cycle between dose fractions.
True Tales of Medical Physics,
by Jacob Van Dyk.
Despite the apparent advantages of delivering radiation in many fractions, recently a new technique has been proposed in which the radiation is applied very quickly all at once. In True Tales of Medical Physics (2022), Dr. Radhe Mohan writes
At the time of writing of this chapter, ultra-high dose rate radiotherapy, called FLASH radiotherapy, has become the rage. In contrast with the conventional low dose rate protracted radiotherapy, which requires a fractionated course of up to 40 (sometimes even more) treatments, with each daily fraction taking between 15 and 60 min, in FLASH radiotherapy, the entire treatment can be delivered in a fraction of a second. The question is whether FLASH is something real or just a flash in the pan. Around 2015, a medical physicist, Dr. Alejandro Mazal of Institut Curie, in Paris, France, presented results of a study conducted by Favaudon, et al. (https://www.ncbi.nlm.nih.gov/pubmed/25031268) at his institution showing sparing of normal tissues at ultrahigh dose rates. I was skeptical. Naively, I thought why should the dose rate matter? It is the dose deposited that determines the biological damage. Since Favaudon’s work, many experiments have been carried out all over the world confirming the normal tissue sparing effect of FLASH and, equally importantly, showing that the response of tumours to FLASH and conventional low dose rates is about the same. The number of researchers involved in FLASH as well as the number of publications is increasing exponentially. The underlying mechanisms are not yet understood; however, multiple hypotheses are being offered. It turns out that the sparing effect of ultra-high dose rates was discovered in the 1960s and 70s for electron beams. Research activities remained on the back burner until Favaudon’s efforts. The rekindling of interest in FLASH radiotherapy is being thought of as akin to “sleeping beauty awakened.”
What is the mechanism by which FLASH preferentially kills tumor cells while sparing normal cells? Mohan offers some speculation.
The more we learn about FLASH, the more questions arise. Our team is contributing to understanding the basic mechanisms, to designing and conducting experiments to acquire in vivo and in vitro data, and to interpreting the results. The current dominant hypothesis for FLASH seems to be that, at extremely high dose rates, oxygen is depleted, making normal tissues hypoxic (i.e., low in oxygen content) and, therefore, resistant to radiationdamage. Tumours are not spared, possibly because they are already low in oxygen. I have a different hypothesis: FLASH also spares cells of the immune system (T-lymphocytes) that infiltrate the tumour and kill tumour cells. Another hypothesis, that seems to be appropriate at least for radiationtherapy with carbon ions, is that FLASH may actually generate oxygen within the tumour, which sensitizes tumours. The FLASH effect overall may be a combination of all of these factors.

So, should we dribble radiation out in fractions over many weeks, or give it all in one big burst? I don’t know. I do know that if FLASH pans out, we textbook writers need to update our textbooks. I’m rooting for FLASH, because it will certainly be easier on the patient to have only one treatment instead of daily hospital visits over a month. But beware: you'd better aim your radiation beam accurately, because you only have one chance. Don’t throw away your shot!


The Emerging Story of FLASH Radiotherapy, presented by Marie-Catherine Vozenin.

https://www.youtube.com/watch?v=bP6Eve6OUJk


My Shot, from Hamilton, by Lin-Manuel Miranda.

Friday, July 15, 2022

Medical Physics for World Benefit

Screenshot of the website Medical Physics for World Benefit, www.mpwb.org.
Screenshot of the website
Medical Physics for World Benefit,
www.mpwb.org.
In the last two blog posts (here and here), I discussed the book True Tales of Medical Physics, edited by Jacob Van Dyk. Today, I want to bring to your attention something else I learned about when reading True Tales: the group Medical Physics for World Benefit.

[Jacob (Jake) Van Dyk] was the main founder of Medical Physics for World Benefit (www.MPWB.org), an organization devoted to supporting medical physics activities, largely by training and mentoring, especially for lower income settings.

The vision of this organization is to create

A world with access to effective and safe applications of physics and technology in medicine 

and its mission is

To support activities which will yield effective and safe use of physics and technologies in medicine through advising, training, demonstrating, and/or participating in medical physics-related activities, especially in low to middle income countries.

What’s there not to like? 

You can join or donate to the organization on its website.

We are physicists who work in medicine. If you are a medical physicist and care about global health and access to quality health care, consider joining us.

We help low to middle income countries with training, education, and other methods of support. We are registered charities in the USA and Canada. Learn more about donating to MPWB.

Too cheap to give? At least follow Medical Physics for World Benefit on Facebook or Twitter (@medphyswb).

Finally, I’m gonna give ya a tip. Many academic libraries subscribe to a package from Springer Publishing that lets institutional library members download pdf’s of Springer books for free. So, you can download Intermediate Physics for Medicine and Biology, True Tales of Medical Physics, and my recently published Are Electromagnetic Fields Making Me Ill? all at no charge. Then, take the money you saved and donate it to Medical Physics for World Benefit. 

Deal or no deal?