Friday, November 1, 2013

Isotopes of Carbon

One of the fundamental ideas of nuclear physics is the isotope. In the 4th edition of Intermediate Physics for Medicine and Biology, Russ Hobbie and I describe isotopes at the start of Chapter 17.
Each atom contains a nucleus about 100,000 times smaller than the atom. The nuclear charge determines the number of electrons in the neutral atom and hence its chemical properties. The nuclear mass determines the mass of the atom. For a given nuclear charge there can be a number of nuclei with different masses or isotopes. If an isotope is unstable, it transforms into another nucleus through radioactive decay.
In order to understand isotopes, consider the isotopes of carbon, one of the most important elements for life.

12C

The most abundant isotope of carbon is 12C. This isotope is stable represents 99% of all carbon. The nucleus of 12C contains six protons (carbon’s atomic number is six) and six neutrons. The nucleus is basically three alpha particles stuck together.

13C

A second stable isotope is 13C, which contains six protons and seven neutrons. Only about 1% of carbon is 13C. The ratio of 13C to 12C is used to study ancient climates and oceans. Plants preferentially take up 12C, so the 13C/12C ratio provides a way to determine the amount of photosynthesis production, and contains information about the origin of carbon dioxide emission (to learn more, click here)

14C

All isotopes of carbon except 12C and 13C are unstable. The longest-lived unstable isotope is 14C, with a half-life of 5730 years. As with most isotopes containing an overabundance of neutrons, it decays by β- emission (a neutron turns into a proton, with the emission of an electron). In Chapter 16 of IPMB, we describe how the decay of 14C contributes to the background radiation.
We are continuously exposed to radiation from natural sources. These include cosmic radiation, which varies with altitude and latitude; rock, sand, brick, and concrete containing varying amounts of radioactive minerals; the naturally occurring radionuclides in our bodies such as 14C and 40K; and radioactive progeny from radon gas from the earth.
A homework problem in Chapter 17 describes how 14C is used to determine the age of organic remains.
Problem 58 One way to determine the age of biological remains is “carbon-14 dating.” The common isotope of carbon is stable 12C. The rare isotope 14C decays with a half-life of 5,370 yr. 14C is constantly created in the atmosphere by cosmic rays. The equilibrium between production and decay results in about 1 of every 1012 atoms of carbon in the atmosphere being 14C, mostly as part of a CO2 molecule. As long as the organism is alive, the ratio of 12C to 14C in the body is the same as in the atmosphere. Once the organism dies, it no longer incorporates 14C from the atmosphere, and the number of 14C nuclei begins to decrease. Suppose the remains of an organism have one 14C for every 1013 12C nuclei. How long has it been since the organism died?

15C

Isotopes of carbon with even more neutrons can be created in the lab, but they have very short half-lives. For instance, 15C has a half-life of only 2.4 seconds

11C

Isotopes that have fewer neutrons that found in the stable form often decay by  β+ emission, also known as positron decay. A proton transforms into a neutron, with the emission of a positron (an anti-electron). These nuclei can also decay by electron capture (an electron is captured by the nucleus, where it combines with a proton to produce a neutron), however most light elements such as carbon preferentially undergo β+ decay rather than electron capture. 11C has a half-life of 20 minutes, and decays by positron emission. It is sometimes used for PET imaging, described in Chapter 17 of IPMB.
If a positron emitter is used as the radionuclide, the positron comes to rest and annihilates an electron, emitting two annihilation photons back to back. In positron emission tomography (PET) these are detected in coincidence. This simplifies the attenuation correction, because the total attenuation for both photons is the same for all points of emission along each γ ray through the body (see Problem 54). Positron emitters are short-lived, and it is necessary to have a cyclotron for producing them in or near the hospital.
Many PET applications use 11C-acetate or 11C-choline, which is administered to the patient. Imaging where the 11C decays provides information about where carbon uptake occurs.

10C

Lighter isotopes of carbon, such as 10C, decay quickly; the half-life of 10C is 19 seconds. Such short half-lives make these isotopes difficult to use in PET imaging, even thought they are positron emitters.


By discussing the isotopes of carbon, we survey many of the most important ideas of nuclear physics, particularly those relevant to nuclear medicine.

Friday, October 25, 2013

From Neuron to Brain

From Neuron to Brain, by Stephen Kuffler and John Nicholls, superimposed on Intermediate Physics for Medicine and Biology.
From Neuron to Brain,
by Stephen Kuffler and John Nicholls.
In 1982, when I was accepted into graduate school at Vanderbilt University, I already knew that I wanted to study with John Wikswo, who was measuring the magnetic field of nerve axons. There was just one problem: I didn’t know how nerves worked. So I asked John to recommend some books that would get me up-to-speed before I arrived in Nashville. One text he suggested was From Neuron to Brain, by Stephen Kuffler and John Nicholls. The book taught me the basics of nerve electrophysiology, and allowed me to be (more-or-less) ready to go when I showed up at Vanderbilt.

From Neuron to Brain is now in its 5th edition. I obtained a copy through interlibrary loan, and I’m delighted to say that it still looks to be a great neuroscience textbook. One change is that the authors are different. Kuffler died in 1980, but Nicholls has carried on, now with 5 coauthors (don’t you just hate it when a fine textbook adds additional “coauthors” in later editions!). The Preface to the 5th edition begins
When the First Edition of our book appeared in 1976, its preface stated that our aim was “…to describe how nerve cells go about their business of transmitting signals, how the signals are put together, and how out of this integration higher functions emerge. The book is directed to the reader who is curious about the workings of the nervous system but does not necessarily have a specialized background in biological sciences. We illustrate the main points by selected examples…”

This new, Fifth Edition has been written with the same aim in mind but in a very different context. When the First Edition appeared there were hardly any books, and only a few journals devoted to the nervous system. The extraordinary advances in molecular biology, genetics, and immunology had not been applied to the study of nerve cells or the brain, and the internet was not available for searching the literature. The explosion of knowledge since 1976 means that even though we still want to produce a readable narrative, the topics that have to be addressed and the number of pages have increased. Inevitably, descriptions of certain older experiments have had to be jettisoned, even though they still seem beautiful. Nevertheless, our approach continues to be to follow ideas from their conception to the latest developments. To this end, in this edition we have retained descriptions of classical experiments as well as the newest findings. In this way we hope to present key lines of research of interest for practicing research workers and teachers of neurobiology, as well as for readers who are not familiar with the field.
I’ve always believed the From Neuron to Brain did a great job describing the Hodgkin and Huxley model, a topic that Russ Hobbie and I cover in Chapter 6 of the 4th edition of Intermediate Physics for Medicine and Biology. Many of the key figures from the Hodgkin and Huxley papers are redrawn in a uniform, crisp, elegant style. Some pictures I remember from the first edition, such as the photos of Hodgkin and Huxley, but others—like the illustrations of the detailed structures of potassium and sodium ion channels—are obviously new. Someone put a tremendous amount of time and effort into creating an outstanding collection of illustrations and figures, all with an appropriate and effective use of color, clearly labeled axes, with an uncluttered and simple style. Bravo!

From Neuron to Brain uses little math, and the few equations that do appear are most often just presented, not derived. Those wanting to understand the mathematical basis of the Hodgkin-Huxley model would be well advised to keep a copy of IPMB nearby as you read From Neuron to Brain. Conversely, readers of IPMB who have a weak background in biology might want to keep a copy of From Neuron to Brain close at hand as the work their way through IPMB (especially Chapters 6-9). The two books are complimentary. You won’t find the cable equation written down, much less analyzed, in From Neuron to Brain. But with those gorgeous figures to look at, you may not notice the lack of math.

I really like two other features of From Neuron to Brain. They have an extensive glossary at the back of the book, defining important terms. When I was first learning nerve electrophysiology to prepare for graduate school, one of my biggest obstacles was the vocabulary. Biologists use strange words. I suppose it was more difficult back in those days because we didn’t have Google and Wikipedia (how did we get anything done?), but even today I still appreciate having the glossary handy. Also present in the first edition, and still there now, is an extensive bibliography. Perhaps the beginning student doesn’t refer to the bibliography much, but when you really start digging deep into a subject you want to consult the original papers. As Russ and I work on updating IPMB for the 5th edition, there is always a tension between citing older classic papers and adding new modern ones. From Neuron to Brain has an interesting mix of the new and the old. They provide over 60 pages of citations in small font; I estimate about 40 references per page, for something like 2400 articles. Now that’s a bibliography!

Readers of IPMB looking for more details about nerve electrophysiology will find the 5th edition of From Neuron to Brain to be a valuable text. I’m not familiar with the competing neuroscience textbooks, but I would be surprised if they’re all of this high quality.

Friday, October 18, 2013

Osmosis and the Kidneys

Physics of the Body, by Cameron, Skofronick, and Grant, superimposed on Intermediate Physics for Medicine and Biology.
Physics of the Body,
by Cameron, Skofronick, and Grant.
One textbook that covers much of the same material as the 4th edition of Intermediate Physics for Medicine and Biology—but at a somewhat lower level—is Physics of the Body, by John Cameron, James Skofronick and Roderick Grant. They have chapter titles such as “Physics of the Skeleton,” “Physics of the Ear and Hearing,” and “Physics of the Lungs and Breathing.” They apparently didn’t have the expertise among the three coauthors to write a chapter on the “Physics of the Kidneys,” so they recruited an outside author familiar with both physics and the renal system to write it for them. That author is none other than Russ Hobbie. In their preface they write
Emeritus Professor Russell Hobbie of the University of Minnesota, the author of the more advanced text Intermediate Physics for Medicine and Biology, kindly contributed Chapter 6 [“Osmosis and the Kidneys”] on the physics of osmosis as it relates to fluid transport across membranes in the body. He also contributed to the revision of Chapter 9 [“Electrical Signals from the Body”]. His cooperation is greatly appreciated.
Russ’s chapter covers some of the same topics as in Chapters 4 and 5 of IPMB, such as diffusion and osmotic pressure. However, his Section 6.4 goes into more detail about the anatomy and physiology of the kidney that we do in IPMB. Here’s an excerpt.
The kidneys excrete much of the body’s metabolic waste products—except carbon dioxide and some water which leave through the lungs. They also regulate the concentration of most chemicals in the blood plasma. Each kidney contains over 1 million nephrons. Each nephron is a complete urine-forming unit. Figure 6.5 shows the kidneys and the ureters through which urine flows to the urinary bladder. Figure 6.6 shows a magnified view of a nephron.

Figure 6.7 shows the essential functioning parts of the nephron. Blood from the renal artery passes first by a membrane in the glomerulus, where a large amount of fluid—about 250 ml per minute (~1 cup)—passes through the basement membrane of the glomerulus. This process is called filtration. Careful measurements of dog kidneys using radioactively tagged solute molecules of different radii suggest that the filtration is by pores of 5 nm radius in the basement membrane. The filtration rate is controlled by valves which control the rate of blood flow through the glomerulus and the pressure drop across the glomerular basement membrane. Substances with a molecular weight of 5000 or less pass easily through the membrane with the water. Most proteins, which have a molecular weight of 69,000 or more, do not pass through the pores and remain in the blood. The filtrate then passes through the tubules, where 99% of it is reabsorbed (if it were not reabsorbed, we would void 360 liters of urine per day [!]). The other 1% passes into the collecting system as urine. Unwanted substances are not reabsorbed, so their concentration in the urine increases. Creatinine, a metabolic waste product, and sucrose are not reabsorbed at all. About half of the urea, a nitrogenous product of protein metabolism, is reabsorbed.
One interesting appendix I found when thumbing through Physics of the Body is the “Standard Man.”
In medical physics, where we are concerned with the anatomy and physiology of humans, it is convenient to define the physical characteristics of a “standard man.” While the standard man is nonexistent, the following somewhat arbitrary values are useful for simulation and for computational purposes:

Age: 30 yr
Height: 1.72 m (5 ft 8 in)
Mass: 70 kg
Weight: 690 N (154 lb)
Surface area: 1.85 m2
Body core temperature: 37.0 C
Body skin temperature: 34.0 C
Heat capacity: 3.6 kJ/kg C (0.86 kcal/kg C)
Basal metabolism: 44 W/m2 (38 kcal/m2 hr, 70 kcal/hr, 1680 kcal/day)
Heart rate: 70 beats/min
Blood volume: 5.2 liters
Cardiac output: 5 liters/min
Blood pressure—systolic: 16 kPa (120 mm Hg)
Blood pressure—diastolic: 10.5 kPa (80 mm Hg)
Breathing rate: 15/min
O2 consumption: 0.26 liter/min
CO2 production: 0.21 liter/min
Total lung capacity: 6 liters
Tidal volume: 4.8 liters
Lung dead space: 0.15 liters
John Cameron, who passed away in 2005, was a giant in the field of medical physics. He was one of the founders of the well-known medical physics program at the University of Wisconsin. James Skofronick is emeritus professor in the department of physics at Florida State University. Roderick Grant is an emeritus professor in the department of physics and astronomy at Denison University.

Friday, October 11, 2013

How Well Does a Three-Sphere Model Predict Positions of Dipoles in a Realistically Shaped Head?

When I worked at the National Institutes of Health, I collaborated with Susumu Sato, a neurophysiologist interested in electroencephalography and magnetoencephalography. One of Sato’s goals was to develop methods to localize the source of epileptic seizures in the brain. In a small percentage of patients, these seizures cannot be controlled by drugs and are severe enough to be debilitating. In such cases, the best alternative is surgery: remove the region of the brain where the seizure originates, and you stop the seizures. Obviously, in these patients the surgeon must know what part of the brain to remove, and the more accurately that is known the better. Ideally, you want to localize the source using a noninvasive procedure such as electroencephalography. One way to model the sources of electrical activity in the brain is as a single dipole source. Russ Hobbie and I discuss dipoles and the EEG in Chapter 7 of the 4th edition of Intermediate Physics for Medicine and Biology.
Much can be learned about the brain by measuring the electric potential on the scalp surface. Such data are called the electroencephalogram (EEG). Nunez and Srinivasan have written an excellent book about the physics of the EEG. We briefly examine the topic here. The EEG is used to diagnose brain disorders, to localize the source of electrical activity in the brain in patients who have epilepsy, and as a research tool to learn more about how the brain responds to stimuli (“evoked responses”) and how it changes with time (“plasticity”). Typically, the EEG is measured from 21 electrodes attached to the scalp according to the “10–20 system” (Fig. 7.34). A typical signal from an electroencephalographic electrode is shown in the top panel of Fig. 11.38. One difficulty in interpreting the EEG is the lack of a suitable reference electrode. None of the 21 electrodes in Fig. 7.34 qualifies as a distant ground against which all other potential recordings can be measured. One way around this difficulty is to subtract from each measured potential the average of all the measured potentials. In the problems, you are asked to prove that this “average reference recording” does not depend on the choice of reference electrode; it is a reference independent method.
The reference is to Paul Nunez’s book Electric Fields of the Brain (Oxford University Press, 2005), which is a great starting point to learn about the physics of the EEG.

Sato wanted to localize the dipole as accurately as possible, even if that meant moving beyond the three-sphere model. Therefore, I was recruited to write a computer program to solve the EEG problem for a realistically-shaped head. This was not easy, because no software existed at that time for numerically solving the electric potential produced by a dipole in the brain when it is not spherical (at least, Sato and I didn’t have access to such software). I used a boundary element method to perform the calculation. I needed information about the shape of the skull, scalp, and brain surfaces, and I remember painstakingly digitizing those surfaces by hand from magnetic resonance images, and then tessellating the surfaces with triangles. Our resulting image of the brain graced the cover of the journal Electroencephalography and clinical Neurophysiology for several years.

The cover of Electroencephalography and Clinical Neurophysiology, showing a drawing of the brain from the article How Well Does the Three-Sphere Model Predict Dipoles in a Realistically-Shaped Head? (Electroenceph clin Neurophysiol 87:175–184, 1993).
The cover of Electroencephalography
and Clinical Neurophysiology.
This research culminated in a paper published almost exactly 20 years ago: Roth, B. J., M. Balish, A. Gorbach and S. Sato, 1993, “How well does the three-spheres model predict dipoles in a realistically-shaped head?Electroenceph. clin. Neurophysiol., Volume 87, Pages 175–184. The introduction of the paper is presented below, with references removed.
Electroencephalographic data, such as interictal spikes and evoked responses, are increasingly analyzed using the moving dipole method. The source of the EEG activity is represented as one or more dipoles within the brain; their location, orientation and strength are determined using an iterative least-squares algorithm to fit the calculated potential to the measured EEG data. Although the dipole approximation is an oversimplification, it is a convenient representation of the complex cortical sources. Most often, the potential produced by a dipole is calculated using the 3-sphere model. In this model the brain, skull and scalp are represented as concentric, spherical shells that differ in conductivity. More computationally demanding models use a realistically shaped head; the electrical potential produced by a dipole source is computed either by solving a system of integral equations governing the potential on the brain, skull, and scalp surfaces or by using a finite element model of the head.

In this paper, we compare the 3-sphere model to a realistically shaped head model, in which the brain, skull and scalp surfaces are obtained from magnetic resonance images. We consider a dipole in the temporal or frontal lobe of the brain, and perform a forward calculation using the realistically shaped head model to determine the potential at the 10-20 electrode positions. We then use these data to predict the dipole position by performing an inverse calculation with the 3-sphere model. The average difference between the original and predicted dipole positions is about 2 cm, though differences as large as 4 cm are seen under certain circumstances. Our results are particularly significant for localization of EEG sources of epileptic spikes, which commonly lie in the temporal and frontal lobes.

Friday, October 4, 2013

Medical Physics Qualifying Exams

We have a Medical Physics PhD program here at Oakland University, and this was the week we administered the oral qualifying exam to our current crop of graduate students. Happily, they all passed. In August they also took a battery of written exams about theoretical physics, mathematical methods, and biophysical sciences (Physics, Math, and Biology for short). I have mentioned these exams before in this blog. We consider them to be a common core that our graduate students are expected to master.

These exams do not require knowing extremely advance material, but they do cover a broad range of topics. I take them to be a minimum that our students must know, rather than a target they should aim for. A student who has a strong undergraduate background in physics, math and biology should be able to survive. Some of the more advanced homework problems and examples from the 4th edition of Intermediate Physics for Medicine and Biology sometimes make their way onto these exams.

Let me add a few words about our PhD program. It is aimed at producing research students who can apply physics to medical and biological problems, rather than preparing students for traditional medical physics positions in a hospital. We are not CAMPEP accredited, because that accreditation is mainly for programs aimed narrowly at producing clinical medical physicists. Our students get broad training in both mathematics and medicine, and in both physics and physiology. Their depth comes from doing their research dissertation. After graduating, they go on to a variety of positions in academia, industry, and research laboratories.

Readers of IPMB who want to see how well they would do on our qualifying exam can find over ten years of the written exams at https://files.oakland.edu/users/roth/web/qualifierexams.htm. I have four reasons for posting these exams on the web. First, I assume the exams, or at least some of the questions from them, would make the rounds among our graduate students, or at least among some subset of the graduate students, and I would rather they all have equal access. Second, I am often asked to provide guidance and suggestions as to what specific topics might be on these exams (I admit, all of physics, math, and biology is a lot to master), and my answer is have them look at the previous exams. Third, it can be a useful recruiting tool; if a potential applicant wants to know what they are expected to master to succeed in our program, I can send them to the old exams and be confident that they realize what they are getting into. Fourth, failing our qualifying exam is a serious issue. The students only get two tries, and then they must leave the program. I prefer to give a student some direction and help rather wondering if the exam was unfair as I tell them that they failed. The downside to posting these exams is that I need to keep coming up with new problems each year. While some identical problems from old exams appear on later exams, I try to minimize this. So, writing the exams (which I do largely myself, although with input from the other faculty in the program) is a little harder than it otherwise would be. One useful side effect of posting the exams is that they are all “out there” available to anyone, including our dear readers of IPMB. So, feel free to use them as you wish. Sorry, but I don’t have solutions I can send you.

In addition to these written exams, each student must stand in front of a group of (intimidating?) faculty and answer questions about “everything”: all the topics from the written exams, plus questions related to their research, and to any other part of physics, mathematics, or biology that might strike the questioner’s fancy. This grilling is what our students went through on Wednesday, successfully. I think the students fear this part of the exam most of all, but I believe they grow from the experience.

Congratulations to this year’s students. I hope readers of IPMB find these exams useful.

Friday, September 27, 2013

Hermann von Helmholtz, Biological Physicist

Who was the greatest biological physicist ever? That’s a difficult question, but one candidate is the German scientist Hermann von Helmholtz (1821–1894). Helmholtz was both a physician and physicist who made important contributions to physiology. Russ Hobbie and I mention him briefly in the 4th edition of Intermediate Physics for Medicine and Biology. In Chapter 6 on Impulses in Nerve and Muscle Cells, we write
The action potential was first measured by Helmholtz around 1850.
Asimov's Biographical Encyclopedia of Science and Technology, by Isaac Asimov, superimposed on Intermediate Physics for Medicine and Biology.
Asimov's Biographical Encyclopedia
of Science and Technology,
by Isaac Asimov.
That is true, but he made many other contributions to biological physics. To highlight some of these, I turn to Asimov’s Biographical Encyclopedia of Science and Technology. Asimov first describes Helmholtz’s work on vision (some of which I have described previously in this blog).
Like [Thomas] Young, Helmholtz made a close study of the function of the eye, and in 1851 he invented an ophthalmoscope, with which one could peer into the eye’s interior—an instrument without which the modern eye specialist would be all but helpless…In addition he revived Young’s theory of three-color vision and expanded it, so that it is now known as the Young-Helmholtz theory.
He also studied sound, the ear, and music (he was a fine musician).
Helmholtz studied that other sense organ, the ear, as well. He advanced the theory that the ear detected differences in pitch through the action of the cochlea, a spiral organ in the inner ear. It contained, he explained, a series of progressively smaller resonators, each of which responded to a sound wave of progressively higher frequency. The pitch we detected depended on which resonator responded.
And as Russ and I noted, he made pioneering measurements in nerve electrophysiology.
Helmholtz was the first to measure the speed of the nerve impulse. His teacher, Muller, was fond of presenting this as an example of something science could never accomplish because the impulse moved so quickly over so short a path. In 1852, however, Helmholtz stimulated a nerve connected to a frog muscle, stimulating it first near the muscle, then farther away. He managed to measure the added time required for the muscle to respond in the latter case.
He also helped formulate the principle of the conservation of energy, an idea he came upon when studying the behavior of muscle.
But he is best known for his contributions to physics and in particular for his treatment of the conservation of energy, something to which he was led by his studies of muscle action. He was the first to show that animal heat was produced chiefly by contracting muscle and that an acid—which we now know to be lactic acid—was formed in the working muscle.
Given my admiration for 19th century physicists, I’m a little surprised that I don’t know more about Helmholtz. This is probably because I am more familiar with the great British physicists—Faraday, Maxwell, Kelvin—than with the Germans of that era (this is odd, given that I am half German). I wouldn’t go so far as to claim Helmholtz was as great a physicist as my Victorian heroes, but I do suggest that he was a greater biological physicist. I think a good argument could be made that he is the greatest of all biological physicists.

Friday, September 20, 2013

Musicophilia

Musicophilia: Tales of Music and the Brain, by Oliver Sacks, superimposed on Intermediate Physics for Medicine and Biology.
Musicophilia: Tales of
Music and the Brain,
by Oliver Sacks.
Those who know me well are aware that I spend considerable time walking my dog Suki. Usually during these walks I am listening to recorded books. Being too cheap to spend money on this habit, I borrow these recordings from the Rochester Hills Public Library. They have a impressive selection, but Suki and I have been at this for a while (she is almost 11 years old), and I have slowly worked my way through their stock of recordings in genres that I ordinarily listen to; science, history, and biography. I don’t view this as a problem, because it has forced me to sample books about topics I would not ordinarily listen to. The most recent example is Musicophilia: Tales of Music and the Brain, by Oliver Sacks. Perhaps you object that this is a science book, but I view it more as a medical book outside my normal experience. Regardless, I was pleasantly surprised to find considerable medical physics discussed.

I had listened previously to Sacks’s delightfully-titled The Man Who Mistook His Wife for a Hat, so I knew what I was getting into. In Musicophilia, Sacks discusses a variety of abnormalities in the perception of music. For instance, he begins with musical hallucinations. This is more than just having a song stuck in your head. These were examples from his clinical practice of people who had, say, suffered a brain injury and afterward would hear music in their mind that they could not distinguish from real music. They sometimes could not turn it on or off, but were stuck with it more or less continuously. Another example is people who, after a stroke, lost the ability to hear music as music. An opera sounds like someone screaming, and a symphony like pots and pans crashing onto the floor. In one case he related, this occurred to a former professional musician. It’s amazing.

Sacks describes all sorts of brain studies being done to examine these patients. There is considerable discussion of data measured using electroencephalography, magnetoencephalography, positron emission tomography, functional magnetic resonance imaging, and transcranial magnetic stimulation—all of which Russ Hobbie and I analyze in the 4th edition of Intermediate Physics for Medicine and Biology. For me, hearing these stories makes me nostalgic for my years working at the National Institutes of Health, where I used to collaborate with neurologists such as Mark Hallett (whose research is mentioned by Sacks). Hallett and his team studied all sorts of odd diseases while I was helping them develop magnetic stimulation. In this case, we physicists and engineers were not discovering new biological ideas or medical abnormalities, but we were providing the tools for others to make these discoveries. And, oh, what tools!

Sacks notes there are some patients who have lost their ability to tell which of two tones is the higher pitch (but can still hum a song). These patients are in contrast with those rare individuals with perfect or absolute pitch; they can tell what note a sound is when heard in isolation. My sister has something approaching perfect pitch. When I was in high school, I took piano lessons. Whenever I played a wrong note while practicing (which was quite often) she would call out from an adjacent room “F-sharp!” or “B-flat!” Do you know how annoying it is not only to have your mistakes pointed out for all to hear, but also to have the specific note identified precisely? Worst of all, she was always right. Some of these piano pieces she had played herself, but others she had not; she was just able to identify the pitch. I have always envied people with perfect pitch, but Sacks raises an interesting point. If people with perfect pitch hear a song played flawlessly but in the wrong key, they get all agitated and upset (he compared this to seeing a painting with all the colors wrong). I, on the other hand, would remain blissfully unaware of the problem. When I was in graduate school in Nashville, I bought a used piano from a blind fellow who refurbished pianos for a living. This particular piano was so old that he could not tighten its strings completely, so the piano was tuned about 3 steps too low (He gave me a good deal on it). The improper tuning never bothered me in the least (my sister hated that piano). However, sometimes my weakness with tonal discrimination has caused me some embarrassment. I played tuba in my high school band, and before concerts the director would have us all “tune up”. The first clarinet would play a note, and we would each play the same note in turn to make sure we were in tune. I always hated this, because I could never tell if I was sharp or flat, and the director would usually end up yelling at me in frustration “You’re flat. Flat! Push the tuning slide in!”

Sacks’s book got me to thinking about all sorts of unusual sensory perceptions. He describes people who could hear but could not perceive music, and I thought it must be like someone born without sight. But Sacks had a better analogy; imagine someone born colorblind (say, completely color blind, instead of just lacking one of three color receptors). How do you describe color to such a person? It has no meaning. How do you describe music to someone born unable to make sense of it? Then I began thinking of other odd sensory inputs, like magnetoreception and the ability to perceive the polarization of light. Humans can’t perceive these signals, but other species can. If you will let me indulge in a bit of anthropomorphization, I suspect there are some bird families who sit in their nest at night saying to each other “those humans can’t perceive magnetic fields or polarization! How to they ever get home?”

Finally, for those of you who know Suki, let me provide a quick update. Earlier this year she damaged her anterior cruciate ligament, and our walks came to an abrupt halt. After much debate (she is a small dog, and is 10 years old) we decided to have her undergo surgery. The veterinary surgeon Dr. McAbee did a marvelous job, and we are now back to our walks as if nothing ever happened.

Friday, September 13, 2013

Plain Words

Plain Words, by Sir Ernest Gowers, superimposed on Intermediate Physics for Medicine and Biology.
Plain Words,
by Sir Ernest Gowers.
When I arrived at graduate school, the main goal given to me by my advisor John Wikswo was to write scientific papers. Of course, I had to write a PhD dissertation, but that was in the distant future. The immediate job was to publish journal articles. John is a good writer, and he insists his students write well. So he recommended that I read the book Plain Words, by Sir Ernest Gowers. (I can’t recall if he made this suggestion before or after reading my first draft of a paper!) I dutifully read the book, which I have come to love. I believe I read the 1973 revision by Bruce Fraser although I am not sure; I borrowed Wikswo’s copy.

Gowers is an advocate for writing simply and clearly. He states in the introduction
Here we come to the most important part of our subject. Correctness is not enough. The words used may all be words approved by the dictionary and used in their right senses; the grammar may be faultless and the idiom above reproach. Yet what is written may still fail to convey a ready and precise meaning to the reader. That it does so fail is the charge brought against much of what is written nowadays, including much of what is written by officials. In the first chapter I quoted a saying of Matthew Arnold that the secret of style was to have something to say and to say it as clearly as you can. The basic fault of present-day writing is a tendency to say what one has to say in as complicated a way as possible. Instead of being simple, terse and direct, it is stilted, long-winded and circumlocutory; instead of choosing the simple word it prefers the unusual.
I have become a strong advocate for using plain language in scientific writing. Over the last three decades I have reviewed hundreds of papers for scientific journals, and I can attest that many scientists should read Plain Words. I have tried to use plain, clear language in the 4th edition of Intermediate Physics for Medicine and Biology (although Russ Hobbie’s writing was quite good in earlier editions of IPMB, which I had nothing to do with, so the book didn’t need much editing by me). Below, Gowers describes three rules for writing, which apply as well to scientific writing as to the official government writing that he focused on.
What we are concerned with is not a quest for a literary style as an end in itself, but to study how best to convey our meaning without ambiguity and without giving unnecessary trouble to our readers. This being our aim, the essence of the advice of both these authorities [mentioned earlier] may be expressed in the following three rules, and the rest of what I have to say in the domain of the vocabulary will be little more than an elaboration of them.
- Use no more words than are necessary to express your meaning. For if you use more you are likely to obscure it and to tire your reader. In particular do not use superfluous adjectives and adverbs and do not use roundabout phrases where single words would serve.
- Use familiar words rather than the far-fetched, for the familiar are more likely to be readily understood.
- Use words with a precise meaning rather than those that are vague, for they will obviously serve better to make your meaning clear; and in particular prefer concrete words to abstract, for they are more likely to have a precise meaning.
For me, the chore of writing is made easier because I like to write. Really, why else would I write this blog each week if I didn’t enjoy the craft of writing (certainly increased book sales can’t justify the time and effort). When my children were young, I once became secretary of their elementary school’s Parent-Teacher Association mainly because my primary duty would be writing the minutes of the PTA meetings. If you were to ask my graduate students, I think they would complain that I make too many changes to drafts of their papers, and we tend to go through too many iterations before submission to a journal. I can usually tell when we are close to a finished paper, because I find myself putting in commas in one draft, and then taking them out in the next. One trick Wikswo taught me is to read the text out loud, listening to the cadence and tone. I find this helpful, and I don’t care what people think when they walk by and hear me reading to myself in my office.

Most Americans have an advantage in the world of science. Modern science is primarily performed and published in the English language, which is our native tongue. I feel sorry for those who must submit articles written in an unfamiliar language—it really is unfair—but that has not stopped me from criticizing their English mercilessly in anonymous reviews. For any young scientist who may be reading this blog (and I do hope there are some of you out there), my advice is: learn to write. As a scientist, you will be judged on your written documents: your papers, your reports, and above all your grant proposals. You simply cannot afford to have these poorly written.

I believe role models are important in writing. One of mine is Isaac Asimov. While I enjoy his fiction, I use his science writing as an example of how to explain difficult concepts clearly. I was very lucky to have encountered his books when in high school. A second role model is not a science writer at all. I have read Winston Churchill’s books, especially his history of the second world war, and I find his writing both clear and elegant. A third model is physicist David Mermin. His textbook Solid State Physics is quite well written, and you can read his essay on writing physics here. You will find learning to write scientific papers difficult if all you read are other scientific papers, because the majority are not well written. If you pattern your own writing after them you will be aiming at the wrong target. Please, learn to write well.

You can read Plain Words online (and for free) here.

This week’s blog entry seems rather long and rambling. Let me conclude with a paraphrase of Mark Twain’s famous quip about letter writing: If I had more time, I would have written a shorter blog entry.

Friday, September 6, 2013

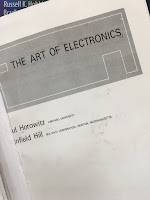
The Art of Electronics

The Art of Electronics, by Horowitz and Hill, superimposed on Intermediate Physics for Medicine and Biology.
The Art of Electronics,
by Horowitz and Hill.
A biological physicist needs many skills, and an important one for experimentalists is electronics. In graduate school, I began my career as an experimentalist, and my PhD advisor John Wikswo required all his students to design and build at least one piece of electronics. My job was to make a timer for our microelectrode puller. I wasn’t experienced with circuit design, so at Wikswo’s suggestion I turned to The Art of Electronics, by Paul Horowitz and Winfield Hill. This wonderful book taught me almost all I know about the subject (OK, that’s not saying much). I used the first edition, but in 1989 a second edition came out. Below is the preface from edition two.
Electronics, perhaps more than any other field of technology, has enjoyed an explosive development in the last four decades. Thus it was with some trepidation that we attempted, in 1980, to bring out a definitive volume teaching the art of the subject. By “art” we meant the kind of mastery that comes from an intimate familiarity with real circuits, actual devices, and the like, rather than the more abstract approach often favored in textbooks on electronics.
The Art of Electronics is particularly useful for understanding active circuits, such as those including transistors and operational amplifiers. I recall that in graduate school my education had a conspicuous hole in that I didn’t understand transistors, and The Art of Electronics helped me learn about them in an intuitive way (I still recall fondly Horowitz and Hill’s “transistor man”).

Russ Hobbie and I don’t discuss electronics explicitly in the fourth edition of Intermediate Physics for Medicine and Biology, but it is implicit in some chapters. For instance, thin film transistor arrays are discussed briefly in Chapter 16, used for detecting x-ray images. In Chapter 6, Figure 6.32 shows the apparatus for making voltage-clamp measurements. The “controller” in that figure is basically an op-amp, and in order to understand how it works one needs to appreciate their “golden rules”: 1) the output does whatever is necessary to make the voltage difference between the inputs zero, and 2) the inputs draw no current. You can do a lot with an op amp, including simple circuits such as a voltage follower (which is needed if you want to record a voltage using a large input impedance, something that is important in bioelectric recordings), simple amplifiers, integrators and differentiators. Horowitz and Hill describe all these circuits and more, in a way that can be understood by the beginner. For me, The Art of Electronics is to electronic circuits what Numerical Recipes is to computational methods: a well-written book that lets you learn the essence of the subject and the practical applications, without getting bogged down in all the esoteric details.

My timer for our microelectrode puller worked, although it wasn’t pretty. As I recall, it was built using leftover parts, and looked something like a big toaster with gigantic, 1950s-style knobs. But it allowed me to pull glass microelectrodes with a reproducible resistance to use in intracellular measurements of voltage in nerve axons. My experimental work culminated in the first simultaneous measurement of the transmembrane potential and magnetic field of a nerve axon (see Barach, Roth, and Wikswo, IEEE Trans. Biomed. Eng., Volume 32, Pages 136–140, 1985; and Roth and Wikswo, Biophys. J., Volume 48, Pages 93–109, 1985). The Biophysical Journal paper is one of my favorites, and represents the high water mark of my experimental career. However, I also like the less-cited IEEE TBME paper for two reasons: it was my very first journal article (appearing in February of 1985, whereas the Biophysical Journal paper appeared in July), and it is my only paper in which I supplied the experimental data and someone else (in this case, Prof. John Barach) performed the theoretical analysis. However, it soon became apparent that my talents and interests were more in mathematical modeling and computer simulation. Nevertheless, I have always had enormous respect for experimental work, which in my view is more difficult than theoretical analysis. I have suffered from a case of “experimentalist envy” since those formative years in graduate school.

Rumor has it that a 3rd edition of The Art of Electronics will appear soon.

Friday, August 30, 2013

The Ascent of Sap in Trees

In Chapter 1 of the 4th edition of Intermediate Physics for Medicine and Biology, Russ Hobbie and I included a homework problem about moving water up trees.
Problem 34 Sap flows up a tree at a speed of about 1 mm s−1 through its vascular system (xylem), which consists of cylindrical pores of 20 μm radius. Assume the viscosity of sap is the same as the viscosity of water. What pressure difference between the bottom and top of a 100 m tall tree is needed to generate this flow? How does it compare to the hydrostatic pressure difference caused by gravity?
When you calculate the pressure needed to push water (that is, sap) up the tree through the xylem, you get (Spoiler Alert!) twenty atmospheres to overcome the viscous resistance of the pores, and ten atmospheres to overcome gravity. How does the tree generate all this pressure? That is a famous old problem known as the “ascent of sap.”

Now I admit that a 100-meter tree is, indeed, very tall; taller than even the Statue of Liberty. But it is not an unrealistic example. The majestic sequoias in California reach this height. The tallest known tree, named Hyperion, is a sequoia (coast redwood) in northern California’s Redwood National and State Parks that reaches a height of 115 m. The leaves at the top of that redwood need water to carry out photosynthesis. How do they get it?

First, let us consider some mechanisms that do not work. The tree cannot suck the water up, as if it were a gigantic drinking straw. Even if the tree could produce a true vacuum at its peak it could only create a pressure difference of one atmosphere, which corresponds to a rise of water of 10 m. Another idea is that the water rises by capillary action, like a giant wick. But the height that can be reached by climbing up a tube via surface tension is inversely proportional to the tube radius, and for xylem’s 20 micron radius tubes water will rise only a tiny fraction of the tree’s height (in Sec. 12.2 of his book Air and Water, Mark Denny estimates that water would rise in xylem by capillary action to only a height of three-fourths of a meter). Osmotic pressure won’t work either, for any realistic concentration gradient. So what is the answer?

There is still some controversy, but the generally accepted mechanism for the ascent of sap is called the cohesion-tension theory. In the leaves, capillary action through very tiny channels helps pull water upwards to replace that which evaporates from the leaf surface. In the larger pores of the xylem, the water is pulled by tension (negative pressure), somewhat like a steel cable pulling an elevator up its shaft. But can water support such a tension? It can, but there is a problem. If any air is present, the system will fail. Think of a piston filled half with water and half air. If you pull on the piston, you will just expand the air as its pressure is reduced. Now, consider the piston with only 1/4th air and 3/4th water; the air still expands when you pull. In fact, if there is even one bubble present in the water, pulling on the piston will cause it to expand. Only if the piston contains no air at all will the water be able to exert a tension force. In other words, water under negative pressure is susceptible to cavitation; the formation of bubbles. Fortunately, the structure of xylem is such that bubbles cannot grow indefinitely, but get trapped in one compartment.

For more details, see “The Cohesion-Tension Mechanism and the Acquisition of Water by Plant Roots,” by Ernst Steudle (Annual Review of Plant Physiology, Volume 52, Pages 847–875, 2001). Below I reproduce his summary of cohesion-tension theory. Note that 100 MPa is 1000 atm!
  • Water has high cohesive forces. It can be subjected to from some ten to several hundred MPa before columns break. When subjected to tensions, water is in a metastable state, i.e. pressure in xylem vessels is much smaller than the equilibrium water vapor pressure at the given temperature. 
  •  Walls of vessels represent the weak part of the system. They may contain air or seeds of water vapor. When a critical tension is reached in the lumen of xylem vessels, pits in vessel walls allow the passage of air through them, resulting in cavitation (embolism). 
  • Water in vessels of higher plants forms a continuous system from evaporating surfaces in the leaves to absorbing surfaces of the roots
and into the soil (soil-plant-air-continuum; SPAC). With few exceptions, water flow within the SPAC is hydraulic in nature, and the system can be described as a network of resistors arranged in series and in parallel. 
  • Evaporation from leaves lowers their water potential and causes water to move from the xylem to evaporating cells across leaf tissue. This reduces the pressure in the xylem, often to values well below zero (vacuum). 
  • Gradients in pressure (water potential) are established along transpiring plants; this causes an inflow of water from the soil into the roots and to the transpiring surfaces in the leaves.
Here is an animation that nicely summarizes this process.

I find the idea of water being hoisted up a tree by tens of atmospheres of tension to be fascinating, if a bit disconcerting. This phenomenon offers a fine example of the important role of physics in biology.