 |
| Fig. 7.13. The exterior potential calculated using the method of Clark and Plonsey. From Intermediate Physics for Medicine and Biology, 4th edition. |
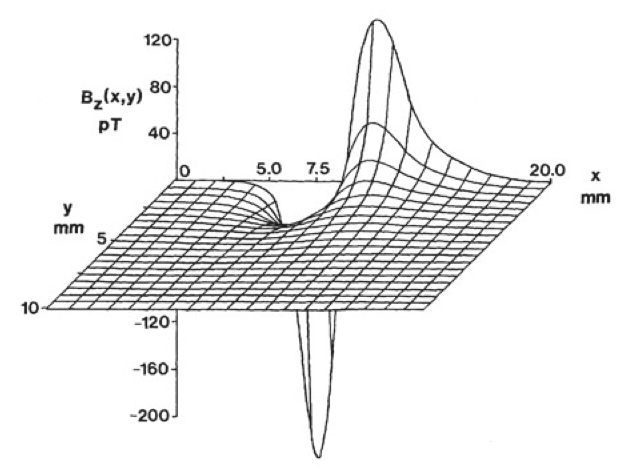 |
| Fig. 8.14. A three-dimensional plot of the magnetic field around the crayfish axon. From Intermediate Physics for Medicine and Biology, 4th edition. |
In the mid-1980s, three-dimensional graphics programs were not as common as they are now, but we had one and I was able to create the figure. What we didn’t have was a publication-quality printer or software to prepare and manipulate figures. Therefore, once I had the plots created, they went to the drafting room to be finished. John usually had one or more undergraduates hired for the sole task of preparing figures. I don’t remember exactly who worked on the two figures for the 2nd edition, but it may have been David Barach, son of Vanderbilt physics professor John Barach. The daftsman’s job was to retrace the figure, thereby providing a higher quality appearance than a dot-matrix printer could provide. As I recall, his job was also to remove hidden lines (I don’t think that our 3-d graphics program was “smart” enough to remove hidden lines on its own). He also labeled all the axes using some really neat rub-on letters that John was able to purchase in both Roman and Greek fonts (note the “μ” in μV in Fig. 7.13). I remember David working on figures at a large, slanted drafting table, using very high quality, vellum-like paper. He had rulers, triangles, and “French curves” of all types. First the drawing was done in pencil, and then traced with black ink. Once finished, additional copies were made using photography by a center in the Vanderbilt Medical School dedicated to such work. Before Photoshop, Powerpoint, and other such programs, that is the way figures were prepared. John had a policy that all graduate students had to get some experience at the drafting table, which I didn’t mind at all. At the risk of sounding like a Luddite who is nostalgic for the days of buggy whips, I think those figures have a little more personality and visual appeal than computer-generated figures drawn today.
The figures appeared in the second edition of Russ’s book, and have continued on through subsequent editions (including the 4th edition, on which I have the high honor of becoming a coauthor). Figures like that required much time and expense to prepare, and are difficult to edit. But my, it was more fun to really “draw” those figures than it is to churn out figures using graphics software.


That sounds painful and time consuming to me!
ReplyDelete