Tuesday, April 14, 2020

Life in Moving Fluids

In Chapter 1 of Intermediate Physics for Medicine and Biology, Russ Hobbie and I discuss the central concept of fluid dynamics: The Reynolds number.
The importance of turbulence (nonlaminar flow) is determined by a dimensionless number characteristic of the system called the Reynolds number NR. It is defined by

                                NR = L V ρ / η ,            (1.62)

where L is a length characteristic of the problem, V a velocity characteristic of the problem, ρ the density, and η the viscosity of the fluid.
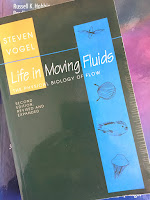
Life in Moving Fluids, by Steven Vogel, superimposed on Intermediate Physics for Medicine and Biology.
Life in Moving Fluids,
by Steven Vogel.
To provide a more in-depth analysis of Reynolds number, I will quote some excerpts from Life in Moving Fluids by Steven Vogel. I chose this book in part because of its insights into fluid dynamics, and in part because it is written so clearly. I use Vogel’s writing as a model for how to explain complicated concepts using vivid and simple language, metaphors, and analogies. He begins by analyzing the drag force on an object immersed in a moving fluid, and then introduces the “peculiarly powerful” Reynolds number, that “centerpiece of biological... fluid dynamics.”
The utility of the Reynolds number extends far beyond mere problems of drag; it’s the nearest thing we have to a completely general guide to what’s likely to happen when solid and fluid move with respect to each other. For a biologist, dealing with systems that span an enormous size range, the Reynolds number is the central scaling parameter that makes order of a diverse set of physical phenomena. It plays a role comparable to surface-to-volume ratio in physiology….
  I love the analogy to surface-to-volume ratio. Vogel continues
One of the marvelous gifts of nature is that this index proves to be so simple—a combination of four variables [L, V, ρ, and η], each with an exponent of unity. It has, however, a few features worth some comment. First, the Reynolds number is dimensionless… so its value is independent of the system of units in which the variables are expressed. Second, in it reappears the kinematic viscosity… What matters isn’t the dynamic viscosity, μ [Russ and I use the symbol η], and the density, ρ, so much as their ratio… Finally, a bit about L, commonly called the “characteristic length.” For a circular pipe, the diameter is used; choosing the diameter rather than the radius is entirely a matter of convention… The value of the Reynolds number is rarely worth worrying about to better than one or at most two significant figures. Still, that’s not trivial when biologically interesting flows span at least fourteen orders of magnitude[!]…

Of greatest importance in the Reynolds number is the product of size and speed, telling us that the two work in concert, not counteractively. For living systems “small” almost always mean slow, and “large” almost always implies fast. That’s why the range of Reynolds numbers so far exceed the eight or so orders of magnitude over which the lengths of organisms vary…
Russ and I explain how the Reynolds number arises from the ratio of two forces, but I don't think we are as clear as Vogel.
What distinguishes regimes of flow is the relative importance of inertial and viscous forces. The former keeps things going; the latter makes them stop. High inertial forces favor turbulence… High viscous forces should prevent sustained turbulence and favor laminar flow by damping incipient eddies…

Another point should be made emphatically. If, for example, the Reynolds number is low, the situation is highly viscous. The flow will be dominated by viscous forces, vortices will be either nonexistent or nonsustained, and velocity gradients will be very gentle… If, in nature, small means slow and large means fast, then small creatures will live in a world dominated by viscous phenomena and large ones by inertial phenomena—this, even though the bacterium swims in the same water as the whale.
 The bacterium-whale comparison is just the sort of insight that Vogel excels at.

Tomorrow, I’ll provide a few more excerpts from Live in Moving Fluids, in which Vogel studies low Reynolds number flow in more detail. 

Monday, April 13, 2020

A Problem with Testing

Chance in Biology, by Mark Denny and Steven Gaines, superimposed on Intermediate Physics for Medicine and Biology.
Chance in Biology,
by Mark Denny and Steven Gaines.
With a pandemic raging, I hear a lot about testing. One problem is we don’t have an adequate supply of test kits to screen for Covid-19. But another problem would arise even if we had enough kits to test everyone. To explain, I’ll describe an example presented in Chance in Biology: Using Probability to Explore Nature, by Mark Denny and Steven Gaines. Their analysis was based on testing for HIV, but I’ll recast the story in terms of the coronavirus.

Suppose we have an accurate test for Covid-19. No test is perfect, so let’s assume it’s correct 99.5% of the time. In other words, its error rate is 0.5% (one error for every two hundred tests). We’ll assume this error rate is the same for false positives and false negatives. Furthermore, we’ll assume Covid-19 is not prevalent, infecting only 0.1% of the population. I doubt this is a good assumption right now, when the virus seems to be infecting everyone, but I can imagine a time not too far in the future (a few weeks maybe, a few months probably) when the fraction of people having the virus is small.

In a population of a million people, 1000 would have Covid-19 and 999,000 would not. First, consider what happens when you test the thousand that are infected. The test would come back positive for Covid-19 in 99.5% of the cases, so it would produce 995 true positives. The test would be in error and give a negative result 0.5% of the time, giving 5 false negatives (the test would say you don’t have the disease when in fact you do). Next, consider the results from testing the 999,000 people who are not infected. Again, the test accuracy is 99.5%, so you would get a negative result (true negatives) for 994,005 people (0.995 times 999,000). You’d make a mistake 0.5% of the time, so you get false positives in 4995 cases (the test would say you have the disease when in fact you don’t). Let’s summarize:
True Positives        995
False Positives     4,995
True Negatives 994,005
False Negatives            5
Now, suppose Michigan Governor Gretchen Whitmer (I’m a big fan of the governor) decides that—to prevent the virus from flaring up again—everyone will be tested; anyone who tests positive for Covid-19 must be quarantined, and anyone who tests negative is free to go wherever they please (restaurants, sporting events, movies... oh how I miss them!). Out of a million people, 5990 will test positive (995 + 4995). Of those, 4995 are mistakes (false positives). In other words, 83% of the people who are forced into quarantine are false positives; they don’t have the disease, but the blasted test said they do and they must suffer for it. Only 17% of the quarantined people are infected.

Is this acceptable? Maybe. We might decide as a state that it’s worth it; we insist on quarantines, even if five out of six people forced into isolation are actually healthy. The needs of the many outweigh the needs of the few. Or, we might decide this is too high a price to pay; people are innocent until proven guilty, so to speak. This decision is not simple. Whitmer will have people mad at her regardless of what she does. But we must decide based on the facts. If the incidence of Covid-19 is 0.1%, and the accuracy of the test is 99.5%, then five out of six quarantined people will be false positives. That’s how the math works. Denny and Gaines summarize it this way:
Although individual tests have a low chance of error, most individuals who are tested are not infected with [Covid-19]. Therefore, we are multiplying a small probability of false positives by a large number of uninfected individuals. Even a minute probability of false positives for individual tests can in this circumstance produce many more false positives than true positives. As long as the disease is rare, even a very accurate test of infection will not be able to accurately identify infected individuals in a random test.
I don’t know the prevalence of Covid-19 or the accuracy of Covid-19 tests. The numbers for the coronavirus may be different than what I used in this example. My point is that even an accurate test can produce many false positives for a rare disease. That’s an important insight, whether or not the numbers are accurate for our current plague.

Chance in Biology is full of examples like this one. It’s a good book (although I like Denny’s Air and Water better). It’s a useful supplement to Intermediate Physics for Medicine and Biology, providing all the probability you need to understand biological physics.

Friday, April 10, 2020

No-Slip Boundary Condition

In Chapter 1 of Intermediate Physics for Medicine and Biology, Russ Hobbie and I discuss the no-slip boundary condition
The velocity of the fluid immediately adjacent to a solid is the same as the velocity of the solid itself.
Life in Moving Fluids, by Steven Vogel, superimposed on Intermediate Physics for Medicine and Biology.
Life in Moving Fluids,
by Steven Vogel.
This seemingly simple condition is not obvious. To learn more, let’s consult Steven Vogel’s masterpiece Life in Moving Fluids: The Physical Biology of Flow.
The No-Slip Condition

The properly skeptical reader may have detected a peculiar assumption in our demonstration of viscosity: the fluid had to stick to the walls… in order to shear rather than simply slide along the walls. Now fluid certainly does stick to itself. If one tiny portion of a fluid moves, it tends to carry other bits of fluid with it—the magnitude of that tendency is precisely what viscosity is about. Less obviously, fluids stick to solids quite as well as they stick to themselves. As nearly as we can tell from the very best measurements, the velocity of a fluid at the interface with a solid is always just the same as that of the solid. This last statement expresses something called the “no-slip condition”—fluids do not slip with respect to adjacent solids. It is the first of quite a few counterintuitive concepts we’ll encounter in this world of fluid mechanics; indeed, the dubious may be comforted to know that the reality and universality of the no-slip condition was heatedly debated through most of the nineteenth century. Goldstein (1938) devotes a special section at the end of his book to the controversy. The only significant exception to the condition seems to occur in very rarefied gases, where molecules encounter one another too rarely for viscosity to mean much.
The reference to a book by Sydney Goldstein
Goldstein, S. (1938) Modern Developments in Fluid Dynamics. Reprint. New York: Dover Publications, 1965.
The no-slip boundary condition is important not only a low Reynolds number but also (and more surprisingly) at high Reynolds number. When discussing a solid sphere moving through a fluid, Russ and I say
At very high Reynolds number, viscosity is small but still plays a role because of the no-slip boundary condition at the sphere surface. A thin layer of fluid, called the boundary layer, sticks to the solid surface, causing a large velocity gradient and therefore significant viscous drag.
Vogel also addresses this point
Most often the region near a solid surface in which the velocity gradient is appreciable is a fairly thin one, measured in micrometers or, at most, millimeters. Still, its existence requires the convention that when we speak of velocity we mean velocity far enough from a surface so the combined effect of the no-slip condition and viscosity, this velocity gradient, doesn’t confuse matters. Where ambiguity is possible, we’ll use the term “free stream velocity” to be properly explicit.
Many fluid problems in IPMB occur at low Reynolds number, where thin boundary layers are not relevant. However, at high Reynolds number the no-slip condition causes a host of interesting behavior. Russ and I write
A thin layer of fluid, called the boundary layer, sticks to the solid surface, causing a large velocity gradient… At extremely high Reynolds number, the flow undergoes separation, where eddies and turbulent flow occur downstream from the sphere.
Turbulence! That’s another story.


See y’all next week for more coronavirus bonus posts.

Thursday, April 9, 2020

Electrophoresis

Random Walks in Biology,  by Howard Berg, superimposed on Intermediate Physics for Medicine and Biology.
Random Walks in Biology,
by Howard Berg.
Electrophoresis is used widely in biomedical research. It’s an example of physics applied to biology that is not discussed in Intermediate Physics for Medicine and Biology. In Random Walks in Biology, Howard Berg describes electrophoresis.
If a particle carries an electric charge, then one can exert a force on it with an electric field. An ion carrying a charge q (esu) in an electric field of intensity E (statvolts/cm) experiences a force in the direction of the field Eq (dynes). [Sorry about the cgs units.] Unfortunately, q is not easy to define. Particles of biological interest contain a variety of ionizable groups whose charges depend strongly on pH. These charges are shielded by counter-ions attracted from the medium in which the particles are suspended. The effectiveness of the shielding depends on the ionic strength. So you do not hear much about particles that have specified electrophoretic drift rates per unit field (as you do, for example, about 30, 50, or 70 S ribosomes [S is a parameter commonly used in centrifuge work, corresponding to velocity per unit acceleration and measured in svedbergs, 1 Sv = 10−13 seconds]). Nevertheless, electrophoretic methods of separating and characterizing biological materials are extremely useful. In practice, they are remarkably simple.
I like the comparison of electrophoresis to centrifugation. Both are examples of diffusion with drift; the physics is nearly the same. Berg continues
…One layers a mixture of particles at the top of a medium designed to suppress convective stirring and passes an electrical current through that, generating patterns analogous to those shown at the bottom of Fig. 4.7… The relative displacement of the … [bands] increases linearly with time, while the spreading increases as the square-root of time; so the separation improves as the square-root of time….
The bottom of Berg’s Fig. 4.7 looks like this:

Bands of particles in either a centrifuge or electrophoresis experiment, where the particles move linearly with time but their diffusion increases as the square root of time.
As noted earlier, convective stirring is suppressed in the ultracentrifuge by the use of density gradients, e.g., of sucrose or CsCl. In an electrophoresis experiment, it is more convenient to use a gel, e.g., polyacrylamide or agarose. At the end of the experiment the bands can be precipitated into the gel and/or stained, e.g., with colored or fluorescent dyes, or the gel can be dried down and exposed to X-ray film to reveal components that are radioactive…
Electrophoretic gels are a workhorse of molecular biology.
Gels not only suppress convective stirring, they act as molecular sieves. The rate of migration of a particle through the gel is strongly dependent on size. A particle that is small compared with the pores in the gel can diffuse through it, almost as if the gel were not there. Particles of intermediate size get through with varying degrees of difficulty. Particles that move through a dilute aqueous medium at roughly the same rate move through the gel at rates that decrease exponentially with size; as a result, an estimate of size (or mass) can be made from a measurement of the logarithm of the displacement. Pieces of DNA and RNA are routinely sorted in this way, as are proteins dissolved in ionic detergents, such as sodium dodecyl sulfate. It is easy to distinguish gels of this kind, because the faster moving bands always are broader; the molecules that drift more rapidly are smaller and have larger diffusion constants.
In a later chapter, Berg develops the analogy between electrophoresis and centrifugation further.
An analogous situation [to density-gradient sedimentation] arises in electrophoresis when the experiment is run in a pH gradient. At equilibrium, a protein will form a band centered at the pH at which it is electrically neutral, i.e., at its isoelectric point. A particle at a more acid pH is positively charged and moves toward the cathode; a particle at a more basic pH is negatively changed and moves toward the anode. Thus, the pH gradient must be acidic near the anode and basic near the cathode.

Wednesday, April 8, 2020

The Localization of Sound

In Chapter 13 of Intermediate Physics for Medicine and Biology, Russ Hobbie and I include a homework problem about the localization of sound.
Problem 20. People use many cues to estimate the direction a sound came from. One is the time delay between sound arriving at the left and right ears. Estimate the maximum time delay. Ignore any diffraction effects caused by the head.
Air and Water, by Mark Denny, superimposed on Intermediate Physics for Medicine and Biology.
Air and Water,
by Mark Denny.
What other ways do people use to sense the direction to the source of a sound? In Air and Water, Mark Denny discusses four.

Sense the Direction that Fluid Moves in a Sound Wave

Some animals can sense the direction that fluid moves in a sounds wave. This requires an ear that responds to motion (a vector) instead of pressure (a scalar). Apparently this ability is common in fish, but not in terrestrial animals.

Comparing the Intensity at Each Ear

Most animals have two ears. If one is closer to the source of a sound than the other, it hears a louder sound. Also, the presence of the body may attenuate or diffract the sound that reaches the far ear, changing its intensity. Denny notes two problems with this mechanism. First, attenuation in air occurs over large distances (70 dB per kilometer), so we would not expect much difference of intensity because the ears are, say, 20 cm apart. Second, the perceived direction is ambiguous. The sound from a source in front of us produces the same intensity at each ear, but so does sound from a source behind us. One way to resolve the ambiguity is to tilt your head as you listen, providing two data point: before and after the tilt.

Comparing the Delay at Each Ear

The homework problem Russ and I wrote is based on the time difference of sound arriving at each ear. This mechanism shares the problem mentioned earlier of direction ambiguity. The biggest problem, however, is that the arrival time at each ear differs by only a small amount: less than a millisecond. Nevertheless, bats appear to make use of this mechanism. For smaller animals (such as hummingbirds) the delays may be too short to be perceptible. Moreover, the speed of sound in water is more than four times the speed of sound in air, so this mechanism is unreliable for aquatic animals. SCUBA divers have trouble localizing sound.

Detecting the Phase Shift Between Each Ear

This mechanism is similar to comparing arrival times, except instead of sensing the delay you sense the phase difference. The method suffers from the same ambiguities discussed earlier, plus another unique to the detection of phase. If the phase shifts by an entire wavelength, it sounds the same as if it had no phase shift at all. So, you don’t want large phase shifts (greater than 2π), but you don’t want small phase shifts that are lost in the noise. Some small animals (such as crickets) have their ears connected by an air-filled tube, so they only detect sound when the two ears are out of phase. Because the speed of sound changes with temperature, any mechanism based on the speed of sound might function differently on a cold day than on a hot one.

Denny concludes
Despite the inherent problems of determining direction, animals combine the methods described above and thereby perform admirably. For example, bats and owls have been shown to localize sounds with 1° to 2°, and dolphins have similar directional acuity. Humans, cats, and opossums can localize sounds within 1° to 6° (Lewis 1983). These abilities are a tribute to the ability of the nervous system to assimilate complex data.
I don’t mind being beaten out by a cat, but we humans need to up our game if we want to do better than those possums.

Tuesday, April 7, 2020

Time-Dependent Solutions to Fick’s Equations

Solving the diffusion equation (also known as Fick’s second law) can require fancy mathematics. After discussing a few solutions in Intermediate Physics for Medicine and Biology, Russ Hobbie and I write
Many other solutions to the diffusion equation and techniques for solving it are known. See Crank (1975) and Carslaw and Jaeger (1959).
Random Walks in Biology, by Howard Berg, superimposed on Intermediate Physics for Medicine and BIology.
Random Walks in Biology,
by Howard Berg.
In Random Walks in Biology, Howard Berg addresses the same point.
Time-dependent solutions to Fick’s equations

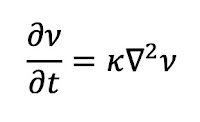
One way to find solutions to Fick’s equations is to look them up! An excellent source is Carslaw and Jaeger (1959), a book dealing with the conduction of heat in solids. The heat equation has the same form as the diffusion equation [see Chapter 4, Homework Problem 19 in IPMB]. In the notation of Carslaw and Jaeger,
The heat equation.
where ν is the temperature and κ is the thermal diffusivity. So, take their results and read C for ν and D for κ. Sources that do not require such translation include Crank (1975) and Jost (1960). But this strategy requires luck. If you happen to find a discussion of just the problem that you are trying to solve, well and good. If not, you will soon be lost in a morass of complex equations.
After reading this, my first thought was: I know Crank, and I know Carslaw and Jaeger, but who’s Jost? The reference is to
Jost, W. 1960. Diffusion in Solids, Liquids, Gases. Academic.
The Oakland University library does not own this book, but even if it did the book might as well be on the moon for all the access I have to it. I can still download journal articles through the library website, but the library building itself is locked up tight because of the coronavirus.

If Jost’s book is anything like Crank’s or Carslaw and Jaeger’s, it’s overflowing with mathematics (just the way I like it).

I was able to find an obituary for Wilhelm Jost, written by Hartweil Calcote.
F. Wilhelm Jost
1903-1988
Professor Dr. sc. nat. Dres. h. c. W. Jost died on September 25, 1988 in G6ttingen. W. Jost was a preeminent scientist who pioneered research and development in combustion, reaction-kinetics in gases and solids, diffusion in solids and phase separation. He authored several monographs that have become classics in the field, among them “Explosions- und Verbrennungsvorg/inge in Gasen” with English and Russian editions. Several Academies of Science elected him as a member and he served on the boards of many scientific societies.
W. Jost was a director of the International Combustion Institute for decades and he founded and directed its German section. His many distinguished awards include the Institute's Sir Alfred Egerton Gold Medal.
F. W. Jost was born in Friedberg in Hessen. He studied chemistry in Halle and Munich and received his Dr. sc. nat. degree in chemistry from the University of Halle in 1926. He then joined M. Bodenstein in Berlin where his work on gas kinetics and hydrocarbon oxidation started. In 1929 Jost became Privatdozent in Hannover. From 1932 to 1933 he spent a year at MIT in Cambridge, Massachusetts, where he founded the basis for the understanding of disorder energies. In 1937 W. lost became a Professor of Physical Chemistry in Leipzig, in 1943 at the University of Marburg and 1951 in Darmstadt, in 1952 he accepted a call to the chair of W. Nernst at the University in G6ttingen.
On the occasion of the honorary promotion in Cambridge it was stated: "This man has always shown himself zealous for liberty, careful of truth and thoroughly civilized".
The members of the International Combustion Institute express their deep sympathy to his wife and his family.
Solving a differential equation by looking the solution up is an odd way to do math, but for the diffusion equation it often works. I will add Jost’s book to my list of post-pandemic reading.

Monday, April 6, 2020

Visualizing the Gaussian Distribution

In Chapter 4 of Intermediate Physics for Medicine and Biology, Russ Hobbie and I include a homework problem about the Péclet number.
Section 4.12

Problem 43. Dimensionless numbers, like the Reynolds number of Chap. 1, are often useful for understanding physical phenomena. The Péclet number is the ratio of transport by drift to transport by diffusion. When the Péclet number is large, drift dominates. The solute fluence rate from drift is Cv, where C is the concentration and v the solvent speed. The solute fluence rate from diffusion is D times the concentration gradient (roughly C/L, where L is some characteristic distance over which the concentration varies).

(a) Determine an expression for the Péclet number in terms of C, L, v, and D.

(b) Verify that the Péclet number is dimensionless.

(c) Which parameter in Sect. 4.12 is equivalent to the Péclet number?

(d) Estimate the Péclet number for oxygen for a person walking.

(e) Estimate the Péclet number for a swimming bacterium. For more about the Péclet number, see Denny (1993) and Purcell (1977).

The Péclet number is sometimes known as the Sherwood number.
Random Walks in Biology, by Howard Berg, superimposed on Intermediate Physics for Medicine and Biology.
Random Walks in Biology,
by Howard Berg.
At the macroscopic level the Péclet number is often large: drift dominates over diffusion. To get an intuitive understanding of how difficult it is to visualize diffusion at the macroscopic scale, consider what Howard Berg says in this excerpt from Random Walks in Biology.
Visualizing the Gaussian distribution: It is instructive to generate the [Gaussian] distributions shown in Fig. 1.3 experimentally [Berg’s Fig. 1.3 is similar to Fig. 4.13 in IPMB]. This can be done by layering aqueous solutions of a dye, such as fluorescein or methylene blue, into water. For a first try, layer the dye at the center of a vertical column of water in a graduated cylinder. The dye promptly sinks to the bottom! It does so because it has a higher specific gravity than the surrounding medium [See Sec. 1.13 in IPMB]. For a second try, match the specific gravity of the medium to the dye by adding sucrose [sugar] to the water. Now the dye drifts about and becomes uniformly dispersed in a matter of minutes or hours. It does so because there is nothing to stabilize the system against convective flow [flow of the liquid caused by density variations]. Any variation in temperature that increases the specific gravity of regions of the fluid that are higher in the column relative to those that are lower drives this flow [that is, if the bottom gets hot, the liquid there becomes less dense and rises, while the more dense liquid at the top sinks]. For a final try, layer the dye into a column of water containing more sucrose at the bottom than at the top, i.e., into a sucrose density gradient; a 0-to-2% w/v [weight per volume] solution will do. Match the specific gravity of the solution of the dye to that at the midpoint of the gradient and layer it there. Now, patterns for the sort shown in Fig. 1.3 [a Gaussian distribution] will evolve over a period of many days. The diffusion coefficients of fluorescein, methylene blue, and sucrose are all about 5 × 10⁻⁶ cm2/sec [5 × 10⁻¹⁰ m2/sec, consistent with Fig, 4.11 in IPMB]. A sucrose gradient x = 10 cm high will survive for a period of time of order t = x2/2D = 107 sec, or about 4 months [I am surprised it would last that long]. The dye will generate a Gaussian distribution with a standard deviation σx = 2.5 cm in a time t = σx2/2D = 6 × 10⁵ sec, or in about 1 week. Try it!
I get the impression he did try it. Berg continues
It is evident from this experiment that diffusive transport takes a long time when distances are large. Here is another example: The diffusion coefficient of a small molecule in air is about 10-1 cm2/sec. If one relied on diffusion to carry molecules of perfume across a crowded room, delays of the order of 1 month would be required. Evidently, the makers of scent owe their livelihood to close encounters [😉], wind, and/or convective flow.
Diffusion is an effective mechanism to transport molecules over short distances, but it works poorly over long distances. The intuition we develop in our everyday life can sometimes mislead us when we think about small-scale biological processes. We generally live in a large Péclet number world. Cells, bacteria, viruses, membranes, and proteins operate at small Péclet number, where diffusion dominates. We can’t trust our intuition when discussing life at low Péclet number.

Friday, April 3, 2020

Diffusion From a Micropipette

In Chapter 4 of Intermediate Physics for Medicine and Biology, Russ Hobbie and I solve the diffusion equation. We consider the classic one-dimensional example of particles released at a point (x = 0) and at one instant (t = 0). The particles diffuse, and the concentration C(x,t) has a Gaussian distribution

An equation for the concentration as a function of position and time during diffusion.

where D is the diffusion constant and N is the number of particles per unit area (assuming diffusion along a tube of fixed cross-sectional area).

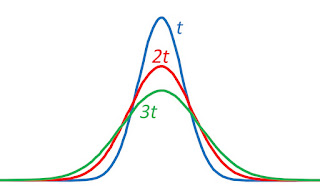
Often this concentration distribution is drawn as a function of x at a fixed time t (a snapshot). Russ and I include such an illustration in IPMB’s Figure 4.13. Below is a modified version of that figure, showing the Gaussian distribution at three times.
The concentration C(x,t) as a function of x at three times t, 2t, and 3t.
Alternatively, we could plot the concentration as a function of t, for a particular location x. Such a plot illustrates how a wave of particles diffuses outward, so at any point x the concentration starts at zero, rises quickly to a peak, and then slowly decays.

The concentration C(x,t) as a function of t at three locations x, 2x, and 3x.
We can calculate the time when the concentration reaches its peak, tpeak, by setting the time derivative of C(x,t) equal to zero and solving for t. The result is tpeak = x2/2D. To find the maximum value of the concentration, Cmax, at any location we plug tpeak into the expression for C(x,t) and find Cmax = 0.242N/x.

Random Walks in Biology, by Howard Berg, superimposed on Intermediate Physics for Medicine and Biologyl.
Random Walks in Biology,
by Howard Berg.
I was motivated to draw the concentration as a function of time by the discussion of diffusion in Howard Berg’s book Random Walks in Biology. He also analyzes the three-dimensional version of this problem. 
Diffusion from a micropipette: A micropipette filled with an aqueous solution of a green fluorescent dye is inserted into a large body of water. At time t = 0, particles of the dye are injected into the water… The total number of particles injected is N… [The diffusion equation] has the solution
An equation for the concentration as a function of position and time during diffusion.
This is a three-dimensional Gaussian distribution… Looking through a microscope, one sees the sudden appearance of a green spot that spreads rapidly outward and fades away. The concentration remains highest at the tip of the pipette, but it decreases there as the three-halves power of time.
I’ll let the reader analyze this case by writing a new homework problem. Enjoy!
Section 4.8

Problem 16 ½. When N particles released at time t = 0 and location r = 0 diffuse, the concentration C(r,t) is governed by
An equation for the concentration as a function of position and time during diffusion.
(a) Show that this expression for C(r,t) obeys the diffusion equation written in spherical coordinates
The diffusion equation in spherical coordinates.
(b) Integrate C(r,t) over all space and show that the number of particles is always N.

(c) Calculate the variance (the mean value of r2) and show that σ2 = 6Dt, as found in Problem 16. You may need an integral from Appendix K.
(d) Calculate the time tpeak when the concentration at a distance r is maximum.

(e) Calculate the maximum concentration, Cmax, at distance r.
(f) Sketch a plot of C(r,t) as a function of r for three times, and then plot C(r,t) as a function of t for three locations.

Thursday, April 2, 2020

Ten Groups Exposed to Radiation

Medical Imaging Physics, by Hendee and Ritenour, superimposed on Intermediate Physics for Medicine and Biology.
Medical Imaging Physics,
by Hendee and Ritenour.
In Medical Imaging Physics, William Hendee and E. Russell Ritenour list ten populations that have been exposed to high levels of ionizing radiation.

Atom Bomb Survivors

At the end of World War II, several hundred thousand Japanese were exposed to large doses of ionizing radiation caused by the dropping of atomic bombs. They have been studied carefully, and provide much of our data about the risk of radiation exposure.

Early Radiologists, Nurses, and Technologists

Medical personnel who worked with early and primitive radiation equipment were exposed to relatively large doses of radiation. They suffered from an increased risk for some cancers, such as leukemia. You can include in this category scientists like Marie Curie, who may have died from radiation encountered during her research.

Uranium and Other Miners

In Intermediate Physics for Medicine and Biology, Russ Hobbie and I discuss Bernard Cohen’s studies of lung cancer risk in uranium miners. They suffer from a toxic mix of radon gas, dust, and tobacco smoke.

Radium Dial Painters

These unfortunate workers (mostly women) applied radioactive paint to illuminate dials. Their sad story is told by Kate Moore in her book The Radium Girls. We could lump the kids exposed to shoe fitting fluoroscopy into this group.

Radiation Therapy Patients

When radiation is used to treat patients with cancer, some of their normal tissue is exposed to high doses. Getting good data about the risk of cancer for such patients is difficult; they already have cancer, which affects the chance of it reoccurring. Hendee and Ritenour point out that in the past some benign disorders have been treated with radiation (for example, ringworm). These patients tended to have an elevated incidence of cancer.

Diagnostic Radiology Patients

Today radiation exposure for most diagnostic imaging is very low, but it has not always been so. Fluoroscopy in the 1940s could give patients a dose of a few grays. These patients provide data about the risk of radiation, although confounding factors make it hard to interpret.

Nuclear Weapons Tests

In the 1950s, many nuclear bombs were tested in the atmosphere over the Pacific Ocean. In particular, Marshall Islanders were exposed to 131I in fallout, leading to thyroid cancer.

Regions with High Natural Background

Several locations have unusually high background radiation levels: Guarapari, Brazil; the Kerala Coast of India; and the Guangdong Province in China. Hendee and Ritenour tell a funny story about the Monazite sand formations in Guarapari. Local inhabitants, who were mostly Catholics, were given hollow medals of the Virgin Mary filled with thermoluminescent dosimetry powder. After three months the powder was analyzed to determine their dose. Hendee and Ritenour add helpfully “the subjects were allowed to keep the medals.”

Air and Space Travel

Cosmic ray exposure increases with altitude and latitude. Hendee and Ritenour state “a flight in a typical commercial airliner results in an equivalent dose rate of approximately 0.005 to 0.01 mSv/hr.” The risk is largest for those who spend a long time in the air (e.g., pilots). Astronauts in low-earth orbit typically receive about 1 mSv per day.  I fear the astronauts on a mission to Mars will provide too much data about the risk of radiation.

Nuclear Accidents

The Chernobyl nuclear accident “resulted in whole-body doses exceeding 1 Gy… to over 200 workers.” Millions of residents of Ukraine, Belarus, and Russia had elevated exposure. Since Medical Imaging Physics was written, the Fukushima disaster has provided additional data on the risk of radiation to humans.


These ten groups have one thing in common: they didn’t want to be subjects of an experiment. In many cases, the exposure was inadvertent or accidental. In other cases—such as for the radium girls—the exposure was criminal. Much of our knowledge about radiation hazards comes from these unwitting victims. It’s data we love to have, but hate to get. 

Wednesday, April 1, 2020

William Harvey’s On the Movement of the Heart and Blood in Animals

A Classic Club book, superimposed on Intermediate Physics for Medicine and Biology.
A Classics Club book
When I was a teenager, I belonged to the Classics Club. Each month I was sent a box containing a couple books, which I’d either purchase or return. Most of these were classics of the Western canon. Some of my favorites were Homer’s Iliad, Plutarch’s Lives, Meditations by Marcus Aurelius, A Tale of Two Cities by Charles Dickens, The Autobiography of Benjamin Franklin, and Selected Tales and Poems by Edgar Allan Poe.

The Beginnings of Modern Science, edited by Holmes Boynton, superimposed on Intermediate Physics for Medicine and Biology.
The Beginnings of Modern Science,
Edited by Holmes Boynton.
One of the books I bought was The Beginnings of Modern Science: Scientific Writings of the 16th, 17th and 18th Centuries, edited by Holmes Boynton. Does this collection contain any biological or medical physics? Yes! The best example is an excerpt from William Harvey’s book On the Movement of the Heart and Blood in Animals (1628). The book was originally written in Latin, and the Classics Club edition was translated into English by R. Willis.
That there is a Circulation of the Blood is confirmed from the first proposition
But lest anyone should say that we give them words only, and make mere specious assertions without any foundation, and desire to innovate without sufficient cause, three points present themselves for confirmation, which being stated, I conceive that the truth I contend for will follow necessarily, and appear as a thing obvious to all.

First, the blood is incessantly transmitted by the action of the heart from the vena cava to the arteries in such quantity that it cannot be supplied from ingesta, and in such a manner that the whole must very quickly pass through the organ.

Second, the blood under the influence of the arterial pulse enters and is impelled in a continuous, equable, and incessant stream through every part and member of the body, in much larger quantity than were sufficient for nutrition, or than the whole mass of fluids could supply.

Third, the veins in like manner return this blood incessantly to the heart from parts and members of the body.

These points proved, I conceive it will be manifest that the blood circulates, revolves, propelled and then returning, from the heart to the extremities, from the extremities to the heart, and thus that it performs a kind of circular motion.
Next Harvey does a back-of-the-envelope calculation of how much blood circulates through the body. This estimate sounds as if it could have appeared in Intermediate Physics for Medicine and Biology.
Let us assume, either arbitrarily of from experiment, the quantity of blood which the left ventricle of the heart will contain, when distended, to be, say two ounces, three ounces, or one ounce and a half; in the dead body I have found it to hold upwards of two ounces. Let us assume, further, how much less the heart will hold in the contracted than in the dilated state; and how much blood will project into the aorta upon each contraction;—and all the world allows that with the systole something is always projected, a necessary consequence demonstrated in the third chapter, and obvious from the structure of the valves; and let us suppose, as approaching the truth, that the fourth, or fifth, or sixth, or even but the eighth part of its charge is thrown into the artery at each contraction; this would give either half an ounce, or three drachms, or one drachm of blood as propelled by the heart at each pulse into the aorta; which quantity, by reasons of the valves at the root of the vessel, can by no means return into the ventricle.

Now in the course of half an hour, the heart will have made more than one thousand beats, in some as many as two, three, and even four thousand. Multiplying the number of drachms propelled by the number of pulses, we shall have either one thousand half ounces, or one thousand times three drachms, or a like proportional quantity of blood, according to the amount which we assume as propelled with each stroke of the heart, sent from this organ into the artery; a larger quantity in every case than is contained in the whole body! In the same way, in the sheep or dog, say that but a single scruple of blood passes with each stroke of the heart, in one half hour we should have one thousand scruples, or about three pounds and a half of blood injected into the aorta; but the body of neither animal contains above four pounds of blood, a fact which I have myself ascertained in the case of the sheep.

Upon this supposition, therefore, assumed merely as a ground for reasoning, we see the whole mass of blood passing through the heart, from the veins to the arteries, and in like manner through the lungs.
Asimov's Biographical Encyclopedia
of Science & Technology,
by Isaac Asimov.
More about Harvey’s work can be found in Asimov’s Biographical Encyclopedia of Science & Technology.
HARVEY, William
English physician
Born: Folkestone, Kent, April 1, 1578
Died: London, June 3, 1657

…[Harvey] was more interested in medical research than in routine practice. By 1616, he is supposed to have dissected eighty species of animals. In particular he studied the heart and blood vessels… He determined the heart was a muscle and that it acted by contracting, pushing blood out. Through actual dissection he noted that the valves separating the two upper chambers of the heart (auricles) from the two lower (ventricles) were one-way. Blood could go from auricle to ventricle but not vice versa. There were one-way values in the veins too, these having been discovered by Fabricius. For that reason, blood in the veins could travel only toward the heart and not away from it….

When Harvey tied off an artery it was the side toward the heart that bulged with blood. When he tied off a vein the side away from the heart bulged. Everything combined to indicate that blood did not oscillate back and forth in the vessels as Galen… had believed but traveled in one direction only.

Furthermore Harvey calculated that in one hour the heart pumped out a quantity of blood that was three times the weight of a man. It seemed inconceivable that blood could be formed and broken down again at such a rate. Therefore it had to be the same blood moving in circles, from the heart to the arteries, from these to the veins, from those back to the heart. The blood, in other words, moved in a closed curve. It circulated.
Part of my collection of Classic Club books, next to Intermediate Physics for Medicine and Biology.
Part of my collection of Classics Club books.