Friday, July 19, 2019

The 5G Health Hazard That Isn’t

Screenshot of the start of the article "The 5G Health Hazard That Isn't" by William Broad in the New York Times.
Screenshot of the start of the article
"The 5G Health Hazard That Isn’t"
by William Broad in the New York Times.
A recent article by William Broad in the New York Timestitled “The 5G Health Hazard That Isn’ttells the sad story of how unfounded fears of radio-frequency radiation were stoked by one mistaken scientist. Broad begins
In 2000, the Broward County Public Schools in Florida received an alarming report. Like many affluent school districts at the time, Broward was considering laptops and wireless networks for its classrooms and 250,000 students. Were there any health risks to worry about?
The district asked Bill P. Curry, a consultant and physicist, to study the matter. The technology, he reported back, was “likely to be a serious health hazard.” He summarized his most troubling evidence in a large graph labeled “Microwave Absorption in Brain Tissue (Grey Matter).”
The chart showed the dose of radiation received by the brain as rising from left to right, with the increasing frequency of the wireless signal. The slope was gentle at first, but when the line reached the wireless frequencies associated with computer networking, it shot straight up, indicating a dangerous level of exposure.

“This graph shows why I am concerned,” Dr. Curry wrote. The body of his report detailed how the radio waves could sow brain cancer, a terrifying disease that kills most of its victims.
Over the years, Dr. Curry’s warning spread far, resonating with educators, consumers and entire cities as the frequencies of cellphones, cell towers and wireless local networks rose. To no small degree, the blossoming anxiety over the professed health risks of 5G technology can be traced to a single scientist and a single chart.
Except that Dr. Curry and his graph got it wrong.
Russ Hobbie and I describe the possible effects of weak electric and magnetic fields in Section 9.10 of Intermediate Physics for Medicine and Biology. We quote a review by Moulder et al. (2005) that concludes
Overall, a weight-of-evidence evaluation shows that the current evidence for a causal association between cancer and exposure to RF [radio frequency] energy is weak and unconvincing.
In his New York Times article, Broad goes on to describe how your “skin” blocks the radio waves. That’s not how I would say it. The waves can’t penetrate your body because of “skin depth” (to learn more about skin depth, do Problem 29 in Chapter 8 of IPMB). An electromagnetic wave penetrates a conductor to a distance on the order of the skin depth, which decreases as the frequency increases. A typical 5G frequency is 3 GHz, corresponding to a skin depth of about 30 mm (a little over an inch). Therefore, deep structures in your body are somewhat shielded from this radiation. It has nothing to do with skin itself; the effect works the same when the wave tries to penetrate the surface of the ocean. It depends on the electrical conductivity. Some planned 5G networks will operate at even higher frequencies (up to 300 GHz). In that case, the skin depth would be ten times smaller than for 3 GHz, or 3 mm, similar to the thickness of skin.

If the amplitude of the electromagnetic wave was high enough, it could burn you. Most people who object to radio frequency waves aren’t worried about heating. They’re concerned about hypothetical nonthermal effects, like causing cancer.

I can think of many reasons to ditch your fancy-schmancy 5G cell phone. Cancer isn’t one of them.

Friday, July 12, 2019

The Fifth Solvay Conference

Participants at the Fifth Solvay Conference in 1927.
This iconic photograph taken at the Fifth Solvay Conference shows the greatest gathering of intelligence ever. Physicists met in October 1927 in Brussels to discuss the then-new theory of quantum mechanics. Russ Hobbie and I mention several of the conference participants in Intermediate Physics for Medicine and Biology.
Niels Bohr
Niels Bohr (Copenhagen, Denmark). The Bohr model of the hydrogen atom and its energy levels is dealt with in Chapter 14 about Atoms and Light, and Bohr’s work on stopping power—how a charged particle loses energy as it passes through tissue—is discussed in Chapter 15 about the Interaction of Photons and Charged Particles with Matter.
Max Born
Max Born (Göttingen, Germany). The Born charging energy appears in Chapter 6 about Impulses in Nerve and Muscle Cells.
William Lawrence Bragg
William Lawrence Bragg (Manchester, England). Chapter 16 about the Medical Uses of X-Rays contains the Bragg-Gray relationship, specifying the absorbed dose in a cavity. The Bragg peak was discovered by Lawrence's father William Henry Bragg (invited to the conference but could not attend).
Arthur Compton
Arthur Compton (Chicago, United States). Compton scattering—the dominant mechanism by which x-rays interact with electrons in tissue at energies around 1 MeV—plays a central roll in Chapter 15. Compton’s name is associated with the Compton wavelength and the Compton cross section.
Marie Curie
Marie Curie (Paris, France). The curie—a unit of radioactivity equal to 37,000,000,000 decays per second—appears in Chapter 17 about Nuclear Physics and Nuclear Medicine. The Curie temperature, discussed in Chapter 8 on Biomagnetism, is named after Marie Curie’s husband Pierre Curie, who died two decades before the Fifth Solvay conference.
Louis de Broglie
Louis de Broglie (Paris, France). de Broglie and his discovery, the relationship between an electron’s momentum and wavelength, is considered when discussing the electron microscope in Chapter 14.
Peter Debye
Peter Debye (Leipzig, Germany). Debye appears in IPMB three times: The debye unit for dipole moment is discussed in Chapter 6, and the Debye length and the Debye-Huckel model are analyzed in Chapter 9 about Electricity and Magnetism at the Cellular Level.
Paul Dirac
Paul Dirac (Cambridge, England). Dirac is most famous for contributing to quantum mechanics, but he is remembered also for the Dirac delta function, which is developed in Chapter 11 about the Method of Least Squares and Signal Analysis.
Albert Einstein
Albert Einstein (Berlin, Germany). The Einstein relationship between diffusion and viscosity is studied in Chapter 4 about Transport in an Infinite Medium, and the unit of the einstein—a mole of photons—appears in Chapter 14. Throughout IPMB, we use Einstein’s ideas about the special theory of relativity and the quantum theory of light, although we rarely mention him by name.
Paul Langevin
Paul Langevin (Paris, France). The Langevin equation is used in Chapter 4 to model the random motion of a particle in a viscous liquid.
Hendrik Lorentz
Hendrik Lorentz (Haarlem, the Netherlands). The Lorentz force exerted on a charge by electric and magnetic fields is a central concept in Chapter 8.
Wolfgang Pauli
Wolfgang Pauli (Hamburg, Germany). The Pauli exclusion principle—no two electrons in an atom can have the same values for all their quantum numbers—is introduced in Chapter 14.
Max Planck
Max Planck (Berlin, Germany). The Nernst-Planck equation is introduced in Chapter 9, Planck’s blackbody radiation formula is analyzed in Chapter 14, and Planck’s constant appears throughout IPMB.
Erwin Schrodinger
Erwin Schrodinger (Zurich, Switzerland). The Schrodinger equation is mentioned in passing at the start of Chapter 3 about Systems of Many Particles.


Watch this fascinating movie taken at the conference.

The Fifth Solvay Conference, 1927.

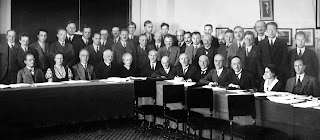
The greatest physicist of the early 20th century who did not attend the Fifth Solvay Conference was Ernest Rutherford, whose gold foil experiment proved that the atom contains a massive nucleus. Rutherford—who is my academic great-great-great-great-grandfather—was at the Seventh Solvay Conference in 1933 (see photograph below; Rutherford is sitting, sixth form the right), which is probably the second greatest gathering of intelligence ever (Einstein did not attend).

Participants at the Seventh Solvay Conference, 1933.
One little known fact about the Fifth Solvay Conference is that several of the participants brought their copy of Intermediate Physics for Medicine and Biology.

Participants at the Fifth Solvay Conference, holding copies of Intermediate Physics for Medicine and Biology.

Friday, July 5, 2019

The Biophysics and Pathophysiology of Lesion Formation During Radiofrequency Catheter Ablation

This week I went with a group of Oakland University undergraduates—part of an American Heart Association-funded summer research program—to Beaumont Hospital in Royal Oak, Michigan to visit Dr. David Haines. Haines is the director of the Heart Rhythm Center, and an expert in using radiofrequency catheter ablation to treat cardiac arrhythmias such as atrial fibrillation.

During the visit, I noticed how physics underlies most of Haines’s work in the clinic. Much of this physics is described in Intermediate Physics for Medicine and Biology. Russ Hobbie and I discuss the electrical behavior of the heart and the electrocardiogram in Chapter 7, arrhythmias such as fibrillation in Chapter 10, and the bioheat equation governing the tissue temperature in Chapter 14.

Cardiac Electrophysiology: From Cell to Bedside, 4th Ed., Edited by Zipes and Jalife, superimposed on Intermediate Physics for Medicine and Biology.
Cardiac Electrophysiology:
From Cell to Bedside
, 4th Ed.,
Edited by Zipes and Jalife.
Haines wrote a chapter about “The Biophysics and Pathophysiology of Lesion Formation during Radiofrequency Catheter Ablation” that appeared in Cardiac Electrophysiology: From Cell to Bedside, a book often cited in IPMB. He begins
The rationale of ablation is that, for every arrhythmia, there is a critical region of abnormal impulse generation or propagation that is required for that arrhythmia to be sustained clinically. If that substrate is irreversibly altered or destroyed, then the arrhythmia should not occur spontaneously or with provocation. To accomplish this with a catheter, several criteria must be met. The technology needs to be controllable: Big enough to incorporate the target but small enough to minimize collateral damage. It needs to be affordable and adaptable to equipment conventionally found in the electrophysiology (EP) suite. Despite considerable experience and experimentation with a variety of catheter ablation technologies, ablation with radiofrequency (RF) electrical energy emerged and has persisted as the favored modality. The study of the mechanisms of RF energy heating and the tissue’s response to this injury will give insight into these and other phenomena and should allow the operator to optimize procedure outcome.
Let me describe some of the physics of catheter ablation.
  • The Catheter. A catheter is used to place the lead used for ablation into the heart. Usually it’s inserted into a vein in the leg, and then snaked through the vessels into the right atrium. (Ablating tissue in the left atrium is trickier; you may have to create a small hole between the atria by doing a transseptal puncture.) Catheterization is less invasive than open heart surgery, so some patients can avoid even a single night in the hospital after treatment.
  • Radiofrequency Energy. Ablation is performed using electrical energy with a frequency between 0.3 and 1 MHz (in the frequency band of AM radio). These frequencies are too high to cause direct electrical stimulation of muscles or nerves. The mechanism of ablation is Joule heating, like in your toaster, which raises the temperature of the tissue within a few millimeters of the lead tip.
  • Lesion Formation. Cells become irreversibly damaged at temperatures on the order of 50° C. The temperature of the lead tip is kept below 100° C to avoid boiling the plasma and coagulating proteins.
  • Atrial Fibrillation. Atrial fibrillation is the most common arrhythmia treated with ablation. Fibrillation means that the electrical wave fronts propagate in a irregular and chaotic way, so the mechanical contraction is unorganized and ineffective. Unlike ventricular fibrillation, which is lethal in minutes if not defibrillated, a person can live with atrial fibrillation, but the heart won’t pump efficiently causing fatigue, the backup of fluid into the lungs, and an increased risk of stroke.
  • Electrical Mapping. The first part of the clinical procedure is to map the arrhythmia. Multiple electrodes on the catheter record the electrocardiogram throughout the atrium, locating the reentrant pathway or the focus (an isolated spot that initiates a wave front). If the arrhythmia is intermittent, then it may need to be triggered by electrical stimulation in order to map it.
  • Ablation Sites. Once the arrhythmia is mapped, the doctor can determine where to ablate the tissue. Usually many isolated spots will be ablated to create a large lesion, often located around the pulmonary veins where many reentrant pathways occur.
While visiting Beaumont, the students and I talked with Haines about his career, and watched him perform a procedure. The team of specialists and their high-tech equipment were impressive; an example of physics and engineering intersecting physiology and medicine.

Cardiac Electrophysiology: From Cell to Bedside alongside Intermediate Physics for Medicine and Biology.
My copy of Cardiac Electrophysiology:
From Cell to Bedside
, alongside IPMB.
I’ll end by quoting Haine’s chapter summary in Cardiac Electrophysiology: From Cell to Bedside.
During RF catheter ablation, RF current passes through the tissue in close contact with the electrode and is resistively heated. The temperature of the tissue at the border of the lesion is reproducible in the 50°C to 55°C range. It is likely that the dominant model of myocardial injury is thermal, although electrical fields have been demonstrated to stun and kill cells depending on the field intensity. On inspection of the myocardial lesions, the tissue shows evidence of desiccation, inflammation, and microvascular injury, which certainly leads to ischemia. Late injury or recovery of the tissue at the lesion border zone may occur as a result of progression or resolution of inflammatory response or endothelial injury. On the cellular level, many possible mechanisms of myocyte damage exist, but membrane injury probably dominates. This may lead to cellular depolarization, intracellular Ca2+ overload, and cell death. Further damage to the cytoskeleton, cellular metabolism, and nucleus may occur at lower temperatures with more prolonged hyperthermia exposure. RF catheter ablation has been proven to be an effective clinical modality for the treatment of arrhythmias, but many of the basic pathophysiologic effects of this empirical procedure on the tissue and cellular level remain to be determined.

Dr. David Haines of Beaumont Hospital.
https://www.youtube.com/watch?v=FZdHk2dznWk

An interview with Dr. David Haines to discuss radiofrequency ablation.

Friday, June 28, 2019

The Innovators

The Innovators: How a Group of Hackers, Geniuses, and Geeks Created the Digital Revolution, by Walter Isaacson, superimposed on Intermediate Physics for Medicine and Biology.
The Innovators: How a Group
of Hackers, Geniuses, and Geeks
Created the Digital Revolution
,
by Walter Isaacson.
Computers play a large and growing role in biomedical research. Intermediate Physics for Medicine and Biology contains four computer programs that illustrate the computations behind topics such as the Hodgkin-Huxley model and computed tomography. To learn more about the history of computers, I read The Innovators: How a Group of Hackers, Geniuses, and Geeks Created the Digital Revolution, by Walter Isaacson. The introduction begins
The computer and the Internet are among the most important inventions of our era, but few people know who created them. They were not conjured up in a garret or garage by solo inventors suitable to be singled out on magazine covers or put into a pantheon with Edison, Bell, and Morse. Instead, most of the innovations of the digital age were done collaboratively. There were a lot of fascinating people involved, some ingenious and a few even geniuses. This is the story of these pioneers, hackers, inventors, and entrepreneurs—who they were, how their minds worked, and what made them so creative. It’s also a narrative of how they collaborated and why their ability to work as teams made them even more creative.
Mr. Ray Dennis, my FORTRAN teacher at Shawnee Mission South High School.
Mr. Ray Dennis,
my FORTRAN teacher at
Shawnee Mission South High School.
From the 1977-1978 school yearbook.
Transistors, microchips and computers were invented before I was born, but I witnessed the rise of personal computers and the creation of the Internet in the 70s, 80s. and 90s. My first experience with computers was during my senior year of high school (1978), when I took a programming class based on the computer language FORTRAN. It was the most useful class I ever took; I programmed in FORTRAN almost every day for decades. At that time, many computers used punch cards to input programs. I remember typing up a stack of cards during class and giving them to my teacher, Ray Dennis, who ran them on an off-site computer after school. The next day he would return our cards along with our output on folded, perforated paper. Mistype one comma and you lost a day. I learned to program with care.

The next year I attended the University of Kansas, where they were phasing out punch cards and replacing them with time-sharing terminals. I thought it was the greatest advance ever. During my freshmen year, my roommate was an engineering graduate student from California who owned an Apple II, and he let me use it to play a primitive Star Trek video game. The Physics Department purchased a Vax mainframe computer that I used for undergraduate research analyzing light scattering data.

At Vanderbilt, my advisor John Wikswo made sure each of his graduate students had their own computer (an IBM clone), which I thought was amazing. I also got my first email account. During my grad school years I followed the rivalry between Bill Gates and Steve Jobs. After starting as a PC guy,  I moved to the National Institutes of Health in 1988 and switched over to an Apple Macintosh, and have been a loyal Mac man ever since. I remember going to a lecture at NIH about something called the World Wide Web, and thinking that it sounded silly. Since then, I’ve seen the rise of Yahoo!, Google, and Wikipedia, and I write these posts ever week using blogger. All these developments and more are described in The Innovators

I’m a fan of Walter Isaacson. He’s written several “genius biographies (Steve Jobs, Leonardo da Vinci, Albert Einstein, Ben Franklin), but my favorite of his books is The Wise Men, the story of six influential leaders—Averell Harriman, Dean Acheson, George Kennan, Robert Lovett, John McCloy, and Charles Bohlen—during the cold war. The Innovators reminds me of The Wise Men in that it focuses on the interactions among a group, rather than the contributions of an individual.

For readers of IPMB who use computers for biomedical research, I recommend The Innovators. It provides insight into how the digital world was invented, and the role of collaboration in science and technology. Enjoy!

Friday, June 21, 2019

More About Implantable Microcoils for Intracortical Magnetic Stimulation

Three years ago, I wrote a post in this blog discussing an article by Seung Woo Lee and his coworkers (“Implantable Microcoils for Intracortical Magnetic Stimulation,” Science Advances, 2:e1600889, 2016). They claimed to have performed magnetic stimulation of nerves by passing a 40 mA, 3 kHz current through a single-turn microcoil with a size less than a millimeter. I claimed that the electric field induced in the surrounding tissue by such a coil would be much smaller than Lee et al. predicted. In their Figure 2 they calculated that a 1 mA current induced an electric field on the order of 2 V/m. I calculated an electric field about a million times smaller, and concluded “their results are too strange to believe and too important to ignore.”

I didn’t ignore them. Recently a graduate student here at Oakland University, Mohammed Alzahrani, and I tested the hypothesis that excitation using microcoils is caused by capacitive coupling rather than magnetic stimulation. The picture below shows our model. The current at the left end of the microcoil passes through the capacitance of the insulation and enters the surrounding tissue. It then flows through the tissue, possibly exciting neurons along its path, until reentering the wire through the capacitance near the right end.


Does this model look familiar? It’s similar to the cable model for a nerve axon (for more about the cable model, see Section 6.11 of Intermediate Physics for Medicine and Biology). The wire in our model is analogous to the intracellular space of the axon in the traditional cable model, and the insulation surrounding the wire is analogous to the cell membrane. Our model’s even simpler than the traditional cable model because the conductance of the insulation is so low that it can be taken as zero; the only way for current to leave the wire is through the capacitance. This model is not new; it was derived in the 19th century to describe current through the transatlantic telegraph cable.

Our goal was to calculate the electric field assuming capacitive coupling, to see whether it’s larger or smaller than what you’d expect from magnetic stimulation. We concluded
In summary, we predict an electric field in the tissue due to capacitive coupling of about 4 mV/m for a current of 1 mA and 3 kHz. The electric field produced by magnetic stimulation would be thousands of times less, on the order of 0.002 mV/m. Therefore, capacitive coupling should be the dominant mechanism for stimulation with a microcoil.
We haven’t published our results yet, but you can download a preprint on my ResearchGate page (doi 10.13140/RG.2.2.19222.40006). I’m curious what you think.

What’s the moral to this story? As I wrote at the end of my previous post, experiments “need to be consistent with the fundamental physical laws outlined in Intermediate Physics for Medicine and Biology.”

Friday, June 14, 2019

Isotopes to Worry About: Cesium-137, Iodine-131, and Strontium-90

The radiation hazard symbol.
Three hazardous isotopes released by a nuclear explosion or accident are cesium-137, iodine-131, and strontium-90.

Cesium-137

Isotopes with short half lives often have disappeared within days of a nuclear accident, after they emit lots of radiation. Isotopes with long half lives may linger for millennia, but aren’t very radioactive. Isotopes with half lives of a few decades are “just right” for being an environmental hazard; their lifetimes are short enough that they release a lot of radioactivity, but are long enough that they cause decades of danger. Cesium-137 (137Cs) has a half-life of 30 years. It is the main source of remaining radiation at the site of the Chernobyl accident.

Cesium-137 is volatile, meaning it evaporates at high temperatures, allowing it to mix with the air and spread with the wind. In addition, cesium is in the same column of the periodic table as sodium and potassium, so it forms water soluble salts that distribute throughout the body. It beta decays (0.51 MeV) to a meta-stable state of barium-137, which then decays by emission of a gamma ray (0.66 MeV).

Accidental uptake of caesium-137 can be treated with Prussian blue, which binds to it and reduces its biological half-life from 70 to 30 days.

Iodine-131

Iodine-131 (131I) has a half-life of eight days, so it is dangerous for only a few weeks after a nuclear explosion or accident. However, radioactive iodine is concentrated in the thyroid gland, causing thyroid cancer. Iodine-131 undergoes beta decay (0.61 MeV) to xenon-131, which then emits a 0.36 MeV gamma ray. It’s so potent a radioisotope that it’s used for cancer therapy (see Section 17.11 of Intermediate Physics for Medicine and Biology).

After a nuclear accident, people take potassium iodide pills to flood the thyroid gland with non-radioactive iodine, suppressing the uptake of the radioactive isotope.

Strontium-90

Like cesium-137, strontium-90 (90Sr) has a half life of about 30 years. It undergoes beta decay (0.55 MeV) to yttrium-90, which in turn beta decays (2.3 MeV) to stable zirconium-90. Strontium-90 is in the same column of the periodic table as calcium, so it is taken up by bones (it’s a “bone seeker”) and therefore has a long biological half-life (about 18 years).

Dirty Bombs

Want something to worry about? Consider this radiological nightmare: a terrorist dirty bomb consisting of equal parts cesium-137, iodine-131, and strontium-90. Good luck sleeping tonight.

Friday, June 7, 2019

Slice Selection During Magnetic Resonance Imaging

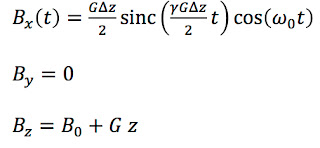
In Chapter 18 of Intermediate Physics for Medicine and Biology, Russ Hobbie and I discuss magnetic resonance imaging. The first step in most MRI pulse sequences is to excite the spins in a slice of the sample. Three magnetic fields are required: A static field B0 in the z direction that aligns the spins, a magnetic field gradient G in the z direction that selects a slice with thickness Δz, and a radiofrequency field in the x direction Bx(t) that excites the spins.

The three magnetic fields applied during slice selection for magnetic resonance imaging: A static field, a gradient field, and a radiofrequency field.

The RF signal is called a π/2 pulse because it rotates the spins through an angle of 90 degrees (π/2 radians), from the z direction to the x-y plane. The Larmor frequency (the angular frequency at which the spins precess at the center of the slice, z = 0) is ω0 = γB0, where γ is the gyromagnetic ratio. Figure 18.23a of IPMB shows the RF signal as a function of time t: an oscillation at the Larmor frequency modulated by the sinc function.

Figure 18.23a of Intermediate Physics for Medicine and Biology, showing the radiofrequency signal used as a π/2 pulse during slice selection.
Figure 18.23a of IPMB, showing the radiofrequency signal
used as a π/2 pulse during slice selection.

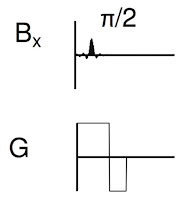
Figure 18.24 illustrates part of the pulse sequence, showing when the RF pulse (Bx, top) and the gradient (G, bottom) are applied.

From Figure 18.24 of Intermediate Physics for Medicine and Biology, showing the part of the pulse sequence responsible for slice selection.
From Figure 18.24 of IPMB, showing the part of the
pulse sequence responsible for slice selection.

Did you ever wonder how the spins behave during this part of the pulse sequence? Do the spins flip all at once near the center of the Ď€/2 pulse, or gradually throughout its duration? Why is there a second negative lobe of the gradient after the Ď€/2 pulse is complete? To answer these questions, let’s analyze slice selection using the Bloch equations—the differential equations governing how spins precess in a magnetic field. Our analysis is similar to that in Section 18.5 of IPMB

If we ignore relaxation, the Bloch equations are

The Bloch equations describing the magnetization during slice selection in magnetic resonance imaging.

where Mx, My, and Mz are the components of the magnetization (a measure of the average spin orientation).

Next, let’s transform to a coordinate system (Mx', My', Mz') rotating at the Larmor frequency. I will leave the details of the transformation to you (they are similar to those in Section 18.5.2 of IPMB). We obtain

The Bloch equations in a rotating coordinate system, describing the magnetization during slice selection in magnetic resonance imaging.

In general the Larmor frequency γB0 is much higher than the modulation frequency γGΔz/2 (thousands of oscillations occur within the central lobe of the sinc function rather than the dozen shown in Fig. 18.23a), so we average over many cycles (as in Section 18.5.3 of IPMB). The Bloch equations simplify to

The Bloch equations in a rotating coordinate system, averaged over time, when describing the magnetization during slice selection in magnetic resonance imaging.

Before we can solve this system of three coupled ordinary differential equations, we need to specify the initial conditions. At t = −∞, Mx' = My' = 0 and Mz' = M0, where M0 is the equilibrium value of the magnetization.

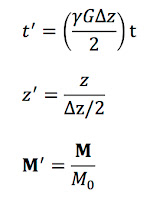
At this point, we define dimensionless variables

Dimensionless variables for time, position, and magnetization, used during slice selection for magnetic resonance imaging.

where M = (Mx, My, Mz). The differential equations become

The Bloch equations in a rotating coordinate system, averaged over time, in terms of dimensionless variables, when describing the magnetization during slice selection in magnetic resonance imaging.

where z' ranges from -1 to 1, and the initial conditions at t' = −∞ are M'x' = M'y' = 0 and M'z' = 1.

I like this elegant system of equations, except all the primes are annoying. For the rest of this post I’ll drop the primes. Your job is to remember that these are dimensionless coordinates in a rotating coordinate system.

The Bloch equations in a rotating coordinate system, averaged over time, in terms of dimensionless variables, when describing the magnetization during slice selection in magnetic resonance imaging. The annoying primes are removed.

I wanted to solve these equations analytically, but couldn’t. I tried weird guesses involving the sine integral and sometimes I thought I was close, but none of my attempts worked. If you, dear reader, find an analytical solution, send it to me. You will be my hero forever.

Having no analytical solution, I wrote a simple Matlab program to solve the equations numerically.
dt=pi/1000;
T=10*pi;
nt=2*T/dt;
dz=0.05;
nz=2/dz+1;
for j=1:nz
    mx(1,j)=0;
    my(1,j)=0;
    mz(1,j)=1;
    z(j)=-1+(j-1)*dz;
    end
t(1)=-T;
for i=1:nt-1
    t(i+1)=t(i)+dt;
    for j=1:nz
        mx(i+1,j)=mx(i,j) + dt*z(j)*my(i,j);
        my(i+1,j)=my(i,j) + dt*(0.5*sin(t(i))/t(i)*mz(i,j) - z(j)*mx(i,j));
        mz(i+1,j)=mz(i,j) - dt*0.5*sin(t(i))/t(i)*my(i,j);
        end
    end
A few notes:
  • I didn’t use a fancy numerical technique, just Euler’s method. To ensure accuracy, I used a tiny time step: Δt = Ď€/1000. If you are not familiar with solving differential equations numerically, see Section 6.14 in IPMB.
  • The sinc function, sin(t)/t, ranges from −∞ to +∞. I had to truncate it, so I applied the RF pulse from −10Ď€ to +10Ď€. The middle, tall phase of the sinc function is centered at t = 0.
  • I actually used the software Octave, which is a free version of Matlab. I recommend it.
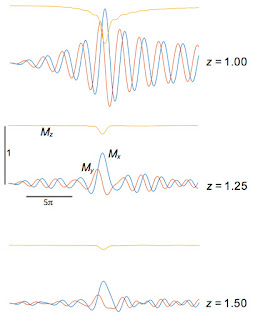
My results are shown below: Mx(t) (blue), My(t) (red), and Mz(t) (yellow) for different values of z, plotted for t from −10Ď€ to +10Ď€.

The magnetization Mx, My, and Mz as functions of time and at several positions within the slice, during slice selection in magnetic resonance imaging.
More notes:
  • Mx is an odd function of z, whereas My and Mz are even. 
  • Mz changes most rapidly during the central phase of the sinc function. 
  • At z = 0, Mz rotates to My and then sits there constant. Remember, we are in the rotating coordinate system; in the laboratory coordinate system the spins precess at the Larmor frequency.
  • As z increases, the magnetization rotates in the x-y plane for times greater than zero. The larger |z|, the higher the frequency; the local precession frequency increasingly differs from the frequency of the rotating coordinate system. 
  • I don’t show z = ±1. Why not? The RF pulse was designed to contain frequencies corresponding to z between -1 and 1, so z = 1 is just on the edge of the slice. What happens outside the slice? The figure below shows that the RF pulse is ineffective at exciting spins at z = 1.25 and 1.5. At exactly z = 1 the signal is just weird.
The magnetization Mx, My, and Mz as functions of time and at several positions outside the slice, during slice selection in magnetic resonance imaging.

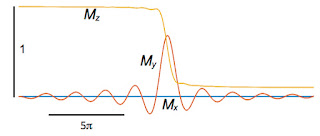
In an MRI experiment we don’t measure the magnetization at each value of z individually, but instead detect a signal from the entire slice. Therefore, I averaged the magnetization over z. Mx is odd, so its average is zero. The averages of My and Mz are shown below.

The magnetization Mx, My, and Mz as functions of time, averaged over the slice, during slice selection in magnetic resonance imaging.

The behavior of My is interesting. After its central peak it decays back to zero because at all the different values of z the spins precess at different frequencies and interfer with each other (they dephase). When averaged over the entire slice, My is nearly zero except briefly around t = 0.

We want My to get big and stay big. Therefore, we need to rephase the spins after they dephase. The second lobe of the gradient field does this. All the plots so far are for times from −10Ď€ to +10Ď€, and the gradient G is on the entire time. Now, let’s extend the calculation so that for times between 10Ď€ and 20Ď€ the gradient is present but with opposite sign (like in Fig. 18.24) and the RF pulse is off. After time 20Ď€, the gradient also turns off and the only magnetic field present is B0. The figure below shows the behavior of the spins.

The magnetization Mx, My, and Mz as functions of time, averaged over the slice, during slice selection in magnetic resonance imaging. This calculation includes the negative lobe of the gradient magnetic field that produces the echo.

We did it! When averaged over the entire slice, My (the red trace) eventually increases, reaches one, and then stays one. It remains constant for times greater than 20Ď€ because we ignore relaxation. The bottom line is that we found a way to excite the spins in the slice so they are all aligned in the y direction (in the rotating coordinate system), and we are ready to apply other fancy pulse sequences to extract information and form an image.

How did this miracle happen? The key insight is that the gradient produces an echo, much like in echo planar imaging. My decays after time zero because the spins diphase, but changing the sign of the gradient rephases the spins, so they are all lined up again when we turn the gradient off at t = 20Ď€. We produce an echo without using a Ď€ pulse; it’s a gradient echo (if you didn’t understand that last sentence, study Figures 18.31 and 18.32 in IPMB).

Until I did this calculation, I didn’t realize that the second phase of the gradient is so crucial. I thought it corrected for a small phase shift and was only needed for high accuracy. No! The second phase produces the echo. Without it, you get no signal at all. And you have to turn it off at just the right time, or the spins will dephase again and the echo will vanish. The second lobe of the gradient is essential; the whole process fails without it.

I learned a lot from analyzing slice selection; I hope you did too.

Friday, May 31, 2019

Introduction to Radiological Physics and Radiation Dosimetry

Introduction to Radiological Physics and Radiation Dosimetry, by Frank Herbert Attix, superimposed on Intermediate Physics for Medicine and Biology.
Introduction to Radiological Physics
and Radiation Dosimetry
,
by Frank Herbert Attix.
In Chapters 15 and 16 of Intermediate Physics for Medicine and Biology, Russ Hobbie and I often cite Introduction to Radiological Physics and Radiation Dosimetry by Frank Herbert Attix. This book, published in 1986, is an oldie but goodie. It is one of a handful of textbooks that Steven Ratliff recommends you own if you plan a career in medical physics (“Resource Letter MPRT-1: Medical Physics in Radiation Therapy,” American Journal of Physics, Volume 77, Pages 774-782, 2009).

In his introduction, Attix discusses how small amounts of radiation can cause so much biological damage.
The reason why so much attention is paid to ionizing radiation, and that an extensive science dealing with these radiations and their interactions with matter has evolved, stems from the unique effects that such interactions have upon the irradiated material. Biological systems (e.g., humans) are particularly susceptible to damage by ionizing radiation, so that the expenditure of a relatively trivial amount of energy (~4 J/kg) throughout the body is likely to cause death, even though that amount of energy can only raise the gross temperature by about 0.001°C. Clearly the ability of ionizing radiations to impart their energy to individual atoms, molecules, and biological cells has a profound effect on the outcome. The resulting high local concentrations of absorbed energy can kill a cell...
In Section 15.3 of IPMB, Russ and I analyze the photoelectric cross section, but don’t derive it from first principles. Attix writes
Theoretical derivation of the interaction cross section for the photoelectric effect is more difficult than for the Compton effect, because of the complications arising from the binding of the electron. There is no simple equation for the differential photoelectric cross section that corresponds to the K-N [Klein-Nishina] formula [relating the Compton cross section to the photon energy, hν]. However, satisfactory solutions have been reported by different authors for several photon energy regions…

The interaction cross section per atom for [the] photoelectric effect [Ď„], integrated over all angles of photoelectron emission, can be written as

Ď„ = k Zn/(hν)m     (cm2/atom)

where [Z is the atomic number,] k is a constant, n ~ 4 at hν = 0.1 MeV, gradually rising to about 4.6 at 3 MeV, and m ~ 3 at hν = 0.1 MeV, gradually decreasing to about 1 at 5 MeV.
In the energy region hν ~ 0.1 MeV and below, where the photoelectric effect becomes most important, it is convenient to remember that

Ď„ ∝ Z4/(hν)3     (cm2/atom)...
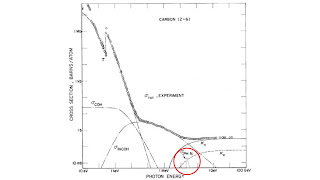
Figure 15.2 of Intermediate Physics for Medicine and Biology. The contribution of the photonuclear scattering cross section is circled in red.
Figure 15.2 of IPMB.
The contribution of the photonuclear
scattering cross section is circled in red.
Figure 15.2 of IPMB shows the cross section for the interaction of photons with carbon as a function of photon energy. The plot includes an odd little blip at 20-30 MeV, and all Russ and I say about it is “The photonuclear scattering cross section PHN is also shown.” Attix gives more detail.
In a photonuclear interaction an energetic photon (exceeding a few MeV) enters and excites a nucleus, which then emits a proton or neutron. (Îł, p) events contribute directly to the kerma, but the relative amount remains less than 5% of that due to pair production. Thus it has been commonly neglected in dosimetry considerations.
(Îł, n) interactions have a greater practical importance because the neutrons thus produced may lead to problems in radiation protection…All of these consequences of (Îł, n) interactions can be regarded as unwanted side effects of the use of higher-energy radiotherapy x-ray beams...
Attix provides insight into the difference between how photons interact with tissue and how charged particles interact.
Charged particles lose their energy in a manner that is distinctly different from that of uncharged radiations (x- or Îł-rays and neutrons). An individual photon or neutron incident upon a slab of matter may pass through it with no interaction at all, and consequently no loss of energy. Or it may interact and thus lose its energy in one or a few “catastrophic” events.

By contrast, a charged particle, being surrounded by its Coulomb electric force field, interacts with one or more electrons or with the nucleus of practically every atom it passes. Most of these interactions individually transfer only minute fractions of the incident particle’s kinetic energy…A 1-MeV charged particle would typically undergo ~105 interactions before losing all of its kinetic energy.
Herb Attix was born in 1925 in Portland, Oregon, and served as a lieutenant in the navy during World War II. He was a professor at the University of Wisconsin, where he chaired the Department of Medical Physics before retiring in 1987. He has served on the board of directors for both the American Association of Physicists in Medicine and the Health Physics Society. In 1994 he received the William D. Coolidge Award, the highest award given by the AAPM.

The International Organization for Medical Physics marked its 50th anniversary by publishing short biographical sketches of 50 medical physicists who have made outstanding contributions to the advancement of medical physics over the last 50 years. You can read it here. Herb Attix was on the list. It reminds me of the NBA’s list of the top 50 players, but the IOMP honorees have contributed much more to mankind.

Friday, May 24, 2019

The Physics of Scuba Diving

In Section 1.15 of Intermediate Physics for Medicine and Biology, Russ Hobbie and I discuss scuba diving.
1.15 Diving

Air is easily compressible, so swimming at large depths can be dangerous as the volume of air in the lungs decreases. One can swim safely for depths of tens of meters (several atmospheres of pressure) using a self-contained underwater breathing apparatus (SCUBA). Compressed air tanks are used to supply air to the lungs, and the pressure of the air is adjusted to match the pressure of the surrounding water.

One physiological effect of breathing high-pressure air is that nitrogen dissolves into the blood, which can lead to a mental impairment known as nitrogen narcosis. Moreover, if the swimmer returns rapidly to the surface after a long deep dive, the lowered pressure allows the dissolved nitrogen to form bubbles in the blood that block blood flow and cause decompression sickness, often called “the bends” (Benedek and Villars 2000). To avoid the bends, swimmers must return to the surface slowly, or replace nitrogen by other gasses, such as helium, that are less soluble in blood.
The Physics of Scuba Diving, by Marlow Anderson, superimposed on Intermediate Physics for Medicine and Biology.
The Physics of Scuba Diving,
by Marlow Anderson.

To learn more, I recommend The Physics of Scuba Diving, by Marlow Anderson. This fascinating book explains many aspects of diving. For instance, what happens if you don’t adjust the air in your lungs to match the surrounding pressure? Anderson explains.
Suppose [at a depth of 30 meters]… the diver fills his lungs with air [at 4 atm], and begins to ascend, while holding his breath. As the ambient pressure decreases, the air in the lungs expands. Since the diver is holding his breath, the air has nowhere to go, and so the flexible lung must expand in volume. If he were to hold his breath until reaching the surface, the lungs would have to expand to 4 times their original volume. Of course, this does not happen—instead, the lungs rupture, which can be an exceedingly dangerous injury. This leads to the number one principle drilled into divers when they train:
The Number One Rule of Scuba Diving
Breathe continuously, and never, never hold your breath.
Any air cavity, not just the lungs, is at risk when diving. Another example is the ear. Anderson writes
When a scuba diver descends, pressure begins to build on the eardrum. In order to continue without pain or damage, this pressure must be counterbalanced by a corresponding pressure in the middle ear. However, ordinary respiration of pressurized air through the scuba regulator will not necessarily convey this needed pressure into the middle ear. Consequently, a typical diver must take action to push the pressurized air into these tiny spaces. Sometimes just a movement of the head and neck is enough to stretch the Eustachian tubes and bring this newly respirated (and pressurized) air into the middle ear. More often, however, the diver finds it necessary to perform a valsalva maneuver. This is an action many of us have taken to counteract the change of pressure experienced when flying in an airplane. Namely, you merely need to block the nostrils, and gently blow; the ears then “pop”. This is enough to move the air from the mouth and nostrils up the Eustachian tubes and into the middle ear. Scuba divers call this process equalization, for obvious reasons. You are taught in scuba training to equalize early, and often!
Anderson then discusses another air pocket that I never thought of.
There is one more air space that must be equalized—the space between the [diving] mask and the eyes…It is for this reason that a diver’s mask includes the nostrils. The diver need only exhale through the nostrils into the mask in order to introduce the denser air with the appropriate pressure she has been breathing from the regulator. If the diver does not equalize this air space, the increasing ambient pressure at depth will push the mask even tighter against the face, eventually causing bruising… and this pressure can even burst the tiny capillaries in the eyes, making them bloodshot. But after only a little experience, divers equalize this air space almost without thinking about it.
Gosh, scuba diving sounds complicated and even dangerous. I don’t think I’ll take up the sport.

The conduction and convection of heat also is important when diving. Russ and I discuss biological thermodynamics and heat transport in Chapters 3 and 4 of IPMB. In particular, we define the convection coefficient for heat loss in Homework Problem 51 of Chapter 3, when analyzing Newton’s law of cooling. The convection coefficient at the surface of our body is much larger in water than in air. Anderson notes
Convection can and does happen in the air too; this is especially true on a windy day, when the moving air continually replaces the air molecules that have been warmed by the body with cold ones: this is the origin of the concept of wind chill. However, the larger [thermal] conductivity of water makes this effect more powerful in water than in air. The practical consequence of this is that a diver in 80° [Fahrenheit] air can happily survive indefinitely. Our body continues to produce heat while turning food into energy. Some of this heat is lost to the surrounding air; indeed, we would quickly become overheated if we did not dissipate some of this energy. But in water of that same temperature more heat is lost than our body produces. The result is that the diver gets colder and colder. Indeed, a diver continually immersed even in warm tropical waters will eventually suffer from hypothermia. This is one of the major problems for divers lost at the surface.
Yikes! Have you ever watched the end of the film Titanic?

Jack’s death scene in Titanic.

Another issue that arises under water is localizing the origin of sounds. Homework Problem 20 of Chapter 13 in IPMB says
Problem 20. People use many cues to estimate the direction a sound came from. One is the time delay between sound arriving at the left and right ears. Estimate the maximum time delay. Ignore any diffraction effects caused by the head.
The solution’s simple: divide the distance between the ears by the speed of sound. Anderson explains
The four-fold increase in the speed of sound in water as compared to air means that our brain cannot as effectively detect the direction sounds come from! Hearing a boat motor overhead but being unable to determine the direction it is coming from is a common and frustrating experience for scuba divers.
As you might expect, The Physics of Scuba Diving contains a long section about nitrogen absorption and the bends. Interestingly, the differential equation governing the absorption of nitrogen by the body is the same as described in Section 2.8 of IPMB: decay plus input at a constant rate. It is also the same equation governing Newton’s law of cooling

dP/dt = (Pa - P)/Ď„ ,

where P is the partial pressure of nitrogen in the blood, Pa is the partial pressure of nitrogen being breathed (a function of depth), t is time, and Ď„ is the time constant. Unfortunately, the process is complicated because the body contains several compartments, each with its own time constant.
It was the eminent British physiologist John Scott Haldane who first made use of the model for nitrogen on-gassing and off-gassing that we have described… His goal in understanding these rates was to help divers avoid the serious health effects of overly rapid decompressions… Haldane observed that various tissues in the body should be expected to have different rates of nitrogen absorption. A liquid (like blood) should be expected to very rapidly absorb nitrogen under pressure brought into contact with it. But a solid tissue like bone might be expected to absorb extra nitrogen at a much slower rate. Haldane consequently built a mathematical model to describe this. He assumed that body tissues could be put into five categories he called compartments, with different rates of absorption.
Anderson then analyzes scuba dive tables using this model. He also gives some historical background about the bends, including an explanation about how the disease got its name.
The illness we call decompression sickness (or the bends) was first reported in the scientific literature in France in 1845, which a mining engineer named Charles-Jean Triger described the limb pain suffered by coal miners; he called their difficulties caisson disease… The mine had been filled with pressurized air to prevent ground water from entering the passages...

The construction (1869-1883) of the Brooklyn Bridge in New York was one of the engineering marvels of the nineteenth century. Massive caissons were constructed, including one as deep as 75 feet. Many workers suffered from caisson disease, including not only limb pain, but also paralysis and even death. The chief engineer for the project was stricken by the disease and remained paralyzed for the rest of his life [his wife took over the role of chief engineer, see David McCullough's wonderful book The Great Bridge]. It was during this period that the illness became popularly know as the bends, in reference to the exaggerated bending of the back workers attempted in a futile effort to avoid the pain. The name compared the posture of the bridge workers to the “Grecian Bend”, a posture adopted by fashionable women of the day.
My daughter Stephanie is taking scuba lessons, and plans on diving this summer at the Great Barrier Reef. Have fun, Stephanie, but be careful. Maybe she should read The Physics of Scuba Diving before she dives.