Showing posts sorted by relevance for query Fourier. Sort by date Show all posts

Friday, April 11, 2014

Bilinear Interpolation

If you know the value of a variable at a regular array of points (xi,yj), you can estimate its value at intermediate positions (x,y) using an interpolation function. For bilinear interpolation, the function f(x,y) is

f(x,y) = a + b x + c y + d x y

where a, b, c, and d are constants. You can determine these constants by requiring that f(x,y) is equal to the known data at points (xi,yj), (xi+1,yj), (xi,yj+1), and (xi+1,yj+1):

f(xi,yj) = a + b xi + c yj + d xi yj
f(xi+1,yj) = a + b xi+1 + c yj + d xi+1 yj
f(xi,yj+1) = a + b xi + c yj+1 + d xi yj+1
f(xi+1,yj+1) = a + b xi+1 + c yj+1 + d xi+1 yj+1 .

Solving these four equations for the four unknowns a, b, c, and d, plugging those values into the equation for f(x,y), and then doing a bit of algebra gives you

f(x,y) = [ f(xi,yj)  (xi+1 – x) (yj+1 – y) + f(xi+1,yj) (x – xi) (yj+1 – y) 
                            + f(xi,yj+1) (xi+1 – x) (y – yj) + f(xi+1,yj+1) (x – xi) (y – yj) ] /(ΔxΔy)

where xi+1 = xi + Δx and yj+1 = yj + Δy. To see why this makes sense, let x = xi and y = yj. In that case, the last three terms in this expression go to zero, and the first term reduces to f(xi,yj), just as you would want an interpolation function to behave. As you can check for yourself, this is true of all four data points. If you hold y fixed then the function is a linear function of x, and if you hold x fixed then the function is a linear function of y. If you assume y = e x, then the function is quadratic.

If you want to try it yourself, see http://www.ajdesigner.com/phpinterpolation/bilinear_interpolation_equation.php

In the 4th edition of Intermediate Physics for Medicine and Biology, Russ Hobbie and I introduce bilinear interpolation in Problem 20 of Chapter 12, in the context of computed tomography. In CT, you obtain the Fourier transform of the image at points in a polar coordinate grid ki, θj. In other words, the points lie on concentric circles in the spatial frequency plane, each of radius ki. In order to compute a numerical two-dimensional Fourier reconstruction to recover the image, one needs the Fourier transform on a Cartesian grid kx,n, ky,m. Thus, one needs to interpolate from data at ki, θj to kx,n, ky,m. In Problem 20, we suggest doing this using bilinear interpolation, and ask the reader to perform a numerical example.

I like bilinear interpolation, because it is simple, intuitive, and often “good enough.” But it is not necessarily the best way to proceed. Tomogrphic methods arise not only in CT but also in synthetic aperture radar (SAR) (see: Munson, D. C., J. D. O’Brien, and W. K. Jenkins (1983) “A Tomographic Formulation of Spotlight-Mode Synthetic Aperture Radar,” Proceedings of the IEEE, Volume 71, Pages 917–925). In their conference proceeding paper “A Comparison of Algorithms for Polar-to-Cartesian Interpolation in Spotlight Mode SAR” (IEEE International Conference on Acoustics, Speech and Signal Processing '85, Volume 10, Pages 1364–1367, 1985), Munson et al. write
Given the polar Fourier samples, one method of image reconstruction is to interpolate these samples to a cartesian grid, apply a 2-D inverse FFT, and to then display the magnitude of the result. The polar-to-cartesian interpolation operation must be of extremely high quality to prevent aliasing . . . In an actual system implementation the interpolation operation may be much more computationally expensive than the FFT. Thus, a problem of considerable importance is the design of algorithms for polar-to-cartesian interpolation that provide a desirable quality/computational complexity tradeoff.
Along the same lines, O’Sullivan (“A Fast Sinc Function Gridding Algorithm for Fourier Inversion in Computer Tomography,” IEEE Trans. Medical Imaging, Volume 4, Pages 200–207, 1985) writes
Application of Fourier transform reconstruction methods is limited by the perceived difficulty of interpolation from the measured polar or other grid to the Cartesian grid required for efficient computation of the Fourier transform. Various interpolation schemes have been considered, such as nearest-neighbor, bilinear interpolation, and truncated sinc function FIR interpolators [3]-[5]. In all cases there is a tradeoff between the computational effort required for the interpolation and the level of artifacts in the final image produced by faulty interpolation.
There has been considerable study of this problem. For instance, see
Stark et al. (1981) “Direct Fourier reconstruction in computer tomography,” IEEE Trans. Acoustics, Speech, and Signal Processing, Volume 29, Pages 237–245.

Moraski, K. J. and D. C. Munson (1991) “Fast tomographic reconstruction using chirp-z interpolation,” 1991 Conference Record of the Twenty-Fifth Asilomar Conference on Signals, Systems and Computers, Volume 2, Pages 1052–1056.
Going into the details of this topic would take me into more deeply into signal processing than I am comfortable with. Hopefully, Problem 20 in IPMB will give you a flavor for what sort of interpolation needs to be done, and the references given in this blog entry can provide an entry to more detailed analysis.

Friday, July 24, 2009

Two-Dimensional Image Reconstruction

In Section 12.4 of the 4th edition of Intermediate Physics for Medicine and Biology, Russ Hobbie and I discuss Two-Dimensional Image Reconstruction from Projections by Fourier Transform. The method is summarized in our Fig. 12.20: i) perform a 1-D Fourier transform of the projection at each angle θ, ii) convert from polar coordinates (k, θ) to Cartesian coordinates (kx, ky), and iii) perform an inverse 2-D Fourier transform to recover the desired image.

I wanted to include in our book some examples where this procedure could be done analytically, thinking that they would give the reader a better appreciation for what is involved in each step of the process. The result was two new homework problems in Chapter 12: Problems 23 and 24. In both problems, we provide an analytical expression for the projection, and the reader is supposed to perform the necessary steps to find the image. Both problems involve the Gaussian function, because the Gaussian is one of the few functions for which the Fourier transform can be calculated easily. (Well, perhaps “easily” is in the eye of the beholder, but by completing the square of the exponent the process is fairly straight forward).

I recall spending considerable time coming up with examples that are simple enough to assign as a homework problem, yet complicated enough to be interesting. One could easily do the case of a Gaussian centered at the origin, but then the projection has no angular dependence, which is dull. I tried hard to find examples that were based on functions other than the Gaussian, but never had any success. If you, dear reader, can think of any such examples, please let me know. I would love to have a third problem that I could use on an exam next time I teach medical physics.

For anyone who wants to get a mathematical understanding of image reconstruction from projections by Fourier transform, I recommend solving Problems 23 and 24. But you won’t learn everything. For instance, in medical imaging the data is discrete, as compared to the continuous functions in these homework problems. This particularly complicates the middle step: transforming from polar to Cartesian coordinates in frequency space. Such a transformation is almost trivial in the continuous case, but more difficult using discrete data (see Problem 20 in Chapter 12 for more on that process). Nevertheless, I have found that performing the reconstruction in a couple specific cases is useful for understanding the algorithm better.

Problems 23 and 24 are a bit more difficult than the average homework problem in our book. The student needs to be comfortable with Fourier analysis. But there is something fun about these problems, especially if you are fond of treasure hunts. I find it exciting to know that there is a fairly simple function f(x,y) representing an object, and that it can be determined from projections F(θ,x') by a simple three-step procedure. Perhaps it mimics, in a very simplistic way, the thrill that developers of computed tomography must have felt when they were first able to obtain images by measuring projections.

If you get stuck on these two problems, contact Russ or me about obtaining the solution manual. Enjoy!


P.S. The Oakland University website is currently undergoing some changes. For the moment, if you have trouble accessing the book website, try http://personalwebs.oakland.edu/~roth/hobbie.htm. I hope to have a more permanent home for the website soon.

Friday, July 30, 2010

X-ray Crystallography

Two weeks ago in this blog, when reviewing Judson’s excellent book The Eighth Day of Creation, I wrote that X-ray crystallography played a central role in the development of molecular biology. But Russ Hobbie and I do not discuss X-ray crystallography in the 4th edition of Intermediate Physics for Medicine and Biology, even though it is a classic example of physics applied in the biomedical sciences. Why? I think one of the reasons for this is that Russ and I made the conscious decision to avoid molecular biophysics. In our preface we write
Biophysics is a very broad subject. Nearly every branch of physics has something to contribute, and the boundaries between physics and engineering are blurred. Each chapter could be much longer; we have attempted to provide the essential physical tools. Molecular biophysics has been almost completely ignored: excellent texts already exist, and this is not our area of expertise. This book has become long enough.
Nevertheless, sometimes—to amuse myself—I play a little game. I say to myself “Brad, suppose someone pointed a gun to your head and demanded that you MUST include X-ray crystallography in the next edition of Intermediate Physics for Medicine and Biology. Where would you put it?”

My first inclination would be to choose Chapters 15 and 16, about how X-rays interact with tissue and their use in medicine, which seems a natural place because crystallography involves X-rays. Yet, these two chapters deal mainly with the particle properties of X-rays, whereas crystallography arises from their wave properties. Also, Chapters 15 and 16 make a coherent, self-contained story about X-rays in medical physics for imaging and therapy, and a digression on crystallography would be out of place. An alternative is Chapter 14 about Atoms and Light. This is a better choice, but the chapter is already long, and it does not discuss electromagnetic waves with wavelengths shorter than those in the ultraviolet part of the spectrum. Chapter 12 on Images is another possibility, as crystallography uses X-rays to produce an image at the molecular level based on a complicated mathematical algorithm, much like tomography uses X-rays to predict an image at the level of the whole body. Nevertheless, if that frightening gun were held to my head, I believe I would put the section on X-ray crystallography in Chapter 11, which discusses Fourier analysis. It would look something like this:
11.6 ½ X-ray Crystallography

One application of the Fourier series and power spectrum is in X-ray crystallography, where the goal is to determine the structure of a molecule. The method begins by forming a crystal of the molecule, with the crystal lattice providing the periodicity required for the Fourier series. DNA and some proteins form nice crystals, and their structures were determined decades ago.* Other proteins, such as those that are incorporated into the cell membrane, are harder to crystallize, and have been studied only more recently, if at all (for instance, see the discussion of the potassium ion channel in Sec. 9.7).

X-rays have a short wavelength (on the order of Angstroms), but not short enough to form an image of a molecule directly, like one would obtain using a light microscope to image a cell. Instead, the image is formed by diffraction. X-rays are an electromagnetic wave consisting of oscillating electric and magnetic fields (see Chapter 14). When an X-ray beam is incident on a crystal, some of these oscillations add in phase, and the resulting constructive interference produces high amplitude X-rays that are emitted (diffracted) in some discrete directions but not others. This diffraction pattern (sometimes called the structure factor, F) depends on the wavelength of the X-ray and the direction (see Prob. 19 2/3). One useful result from electromagnetic theory is that the structure factor is related to the Fourier series of the electron density of the molecule: F is just the an and bn coefficients introduced in the previous three sections, extended to account for three dimensions. Therefore, the electron density (and thus the molecular structure) can be determined if the structure factor is known.

A fundamental limitation of X-ray crystallography is that the crystallographer does not measure F, but instead detects the intensity |F|2. To understand this better, recall that the Fourier series consists of a sum of both cosines (the an coefficients) and sines (bn). You can always write the sum of a sine and cosine having the same frequency as a single sine with an amplitude cn and phase dn (See Prob. 19 1/3)

an cos(ωn t) + bn sin(ωn t) = cn sin(ωn t + dn) . (1)

The measured intensity is then cn2. In other words, an X-ray crystallography experiment allows you to determine cn, but not dn. Put in still another way, the experiment measures the power spectrum only, not the phase. Yet, in order to do the Fourier reconstruction, phase information is required. How to obtain this information is known as the “phase problem,” and is at the heart of crystallographic methods. One way to solve the phase problem is to measure the diffraction pattern with and without a heavy atom (such as mercury) attached to the molecule: some phase information can be obtained from the difference of the two patterns (Campbell and Dwek (1984)). In order for this method to work, the molecule must have the same shape with and without the attached heavy atom present.

* for a fascinating history of these developments, see Judson (1979)

Problem 19 1/3 Use the trigonometric identity sin(A+B) = sinA cosB + cosA sinB to relate an and bn in Eq. (1) to cn and dn.

Problem 19 2/3 Bragg’s law can be found by assuming that the incident X-rays (having wavelength λ) reflect off a plane formed by the regular array of points in the lattice. Assume that two adjacent planes are separated by a distance d, and that the incident X-ray bean falls on this plane at an angle θ with respect to the surface. The condition for constructive interference is that the path difference between reflections from the two planes is an integral multiple of λ. Derive Bragg’s law relating θ, λ and d.

Campbell, I. D., and R. A. Dwek (1984) Biological Spectroscopy. Menlo Park, CA, Benjamin/Cummings.

Judson, H. F. (1979) The Eighth Day of Creation. Touchstone Books
For more information on X-ray crystallography, see http://www.ruppweb.org/Xray/101index.html or http://www.xtal.iqfr.csic.es/Cristalografia/index-en.html.

Friday, April 4, 2014

17 Equations that Changed the World

In Pursuit of the Unknown: 17 Equations that Changed the World, by Ian Stewart, superimposed on Intermediate Physics for Medicine and Biology.
In Pursuit of the Unknown:
17 Equations that Changed the World,
by Ian Stewart.
Ian Stewart’s book In Pursuit of the Unknown: 17 Equations that Changed the World “is the story of the ascent of humanity, told through 17 equations.” Of course, my first thought was “I wonder how many of those equations are in the 4th edition of Intermediate Physics for Medicine and Biology?” Let’s see.
1. Pythagorean theorem: a2+b2=c2. In Appendix B of IPMB, Russ Hobbie and I discuss vectors, and quote Pythagoras’ theorem when relating a vector’s x and y components to its magnitude.

2. Logarithms: log(xy)=log(x)+log(y). In Appendix C, we present many of the properties of logarithms, including this sum/product rule as Eq. C6. Log-log plots are discussed extensively in Chapter 2 (Exponential Growth and Decay).

3. Definition of the derivative: df/dt = limit h → 0 (f(t+h)-f(t))/h. We assume the reader has taken introductory calculus (the preface states “Calculus is used without apology”), so we don’t define the derivative or consider what it means to take a limit. However, in Appendix D we present the Taylor series through its first two terms, which is essentially the same equation as the definition of the derivative, just rearranged.

4. Newton’s law of gravity: F = Gm1m2/d2. Russ and I are ruthless about focusing exclusively on physics that has implications for biology and medicine. Almost all organisms live at the surface of the earth. Therefore, we discuss the acceleration of gravity, g, starting in Chapter 1 (Mechanics), but not Newton’s law of Gravity.

5. The square root of minus one: i2 = -1. Russ and I generally avoid complex numbers, but they are mentioned in Chapter 11 (The Method of Least Squares and Signal Analysis) as an alternative way to formulate the Fourier series. We write the equation as i = √-1, which is the same thing as i2 = -1.

6. Euler’s formula for polyhedra: FE + V = 2. We never come close to mentioning it.

7. Normal distribution: P(x) = 1/√(2πσ) exp[-(x-μ)2/2σ2]. Appendix I is about the Gaussian (or normal) probability distribution, which is introduced in Eq. I.4.

8. Wave equation: 2u/∂t2 = c22u/∂x2. Russ and I introduce the wave equation (Eq. 13.5) in Chapter 13 (Sound and Ultrasound).

9. Fourier transform: f(k) = ∫ f(x) e-2πixk dx. In Chapter 11 (The Method of Least Squares and Signal Analysis) we develop the Fourier transform in detail (Eq. 11.57), and then use it in Chapter 12 (Images) to do tomography.

10. Navier-Stokes equation: ρ (∂v/∂t + v ⋅∇ v) = -∇ p + ∇ ⋅ T + f. Russ and I analyze biological fluid mechanics in Chapter 1 (Mechanics), and write down a simplified version of the Navier-Stokes equation in Problem 28.

11. Maxwell’s equations: ∇ ⋅ E = 0, ∇ × E = -1/c H/∂t, ∇ ⋅ H = 0, and ∇ × H = 1/c E/∂t. Chapter 6 (Impulses in Nerve and Muscle Cells), Chapter 7 (The Exterior Potential and the Electrocardiogram), and Chapter 8 (Biomagnetism) discuss each of Maxwell’s equations. In Problem 22 of Chapter 8, Russ and I ask the reader to collect all these equations together. Yes, I own a tee shirt with Maxwell’s equations on it.

12. Second law of thermodynamics: dS ≥ 0. In Chapter 3 (Systems of Many Particles), Russ and I discuss the second law of thermodynamics. We derive entropy from statistical considerations (I would have chosen S = kB lnΩ rather than dS ≥ 0 to sum up the second law). We state in words “the total entropy remains the same or increases,” although we don’t actually write dS ≥ 0.

13. Relativity: E = mc2. We don’t discuss special relativity in much detail, but we do need E = mc2 occasionally, most notably when discussing pair production in Chapter 15 (Interaction of Photons and Charged Particles with Matter).

14. Schrödinger’s equation: i ħ ∂Ψ/∂t = Ĥ Ψ. Russ and I don’t write down or analyze Schrödinger’s equation, but we do mention it by name, particularly at the start of Chapter 3 (Systems of Many Particles).

15. Information theory: H = - Σ p(x) log p(x). Not mentioned whatsoever.

16. Chaos theory: xi+1 = k xi (1-xi). Russ and I analyze chaotic behavior in Chapter 10 (Feedback and Control), including the logistic map xi+1=kxi(1-xi) (Eq. 10.36).

17. Black-Scholes equation: ½ σ2S22V/∂S2 + rS V/S + V/t – rV = 0. Never heard of it. Something about economics and the 2008 financial crash. Nothing about it in IPMB.
Seventeen is a strange number of equations to select (a medium sized prime number). If I were to round it out to twenty, then I would have three to select on my own. My first thought is Newton’s second law, F=ma, but Stewart mentions that this relationship underlies both the Navier-Stokes equation and the wave equation, so I guess it is already present implicitly. Here are my three:
18. Exponential equation with constant input: dy/dt = a – by. Chapter 2 of IPMB (Exponential Growth and Decay) is dedicated to the exponential function. This equation appears over and over throughout the book. Stewart discusses the exponential function briefly in his chapter on logarithms, but I am inclined to add the differential equation leading to the exponential function to the list. Among its many uses, this function is crucial for understanding the decay of radioactive isotopes in Chapter 17 (Nuclear Physics and Nuclear Medicine).

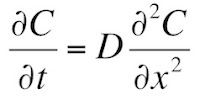
19. Diffusion equation: ∂C/∂t = D ∂2C/∂x2. To his credit, Stewart introduces the diffusion equation in his chapter on the Fourier transform, and indeed it was Fourier’s study of the heat equation (the same as the diffusion equation, with T for temperature replacing C for concentration) that motivated the development of the Fourier series. Nevertheless, the diffusion equation is so central to biology, and discussed in such detail in Chapter 4 (Transport in an Infinite Medium) of IPMB, that I had to include it. Some may argue that if we include both the wave equation and the diffusion equation, we also should add Laplace’s equation, but I consider that a special case of Maxwell’s equations, so it is already in the list.

20. Light quanta: E = hν: Although Stewart included Schrodinger’s equation of quantum mechanics, I would include this second equation containing Planck’s constant h. It summarizes the wave-particle duality of light, and is crucially important in Chapters 14 (Atoms and Light), 15 (Interaction of Photons and Charged Particles with Matter), and 16 (Medical Uses of X Rays).
Runners up include the Bloch equations since I need something from Chapter 18 (Magnetic Resonance Imaging), the Boltzmann factor (except that it is a factor, not an equation), Stokes law, the ideal gas law and its analog the van’t Hoff’s law from Chapter 5 (Transport through Neutral Membranes), the Hodgkin and Huxley equations, the Poisson-Boltzmann equation in Chapter 9 (Electricity and Magnetism at the Cellular Level), the Poisson probability distribution, and Planck’s blackbody radiation law (perhaps in place of E=hν).

Overall, I think studying the 4th edition of Intermediate Physics for Medicine and Biology introduces the reader to most of the critical equations that have indeed changed the world.

Friday, January 3, 2014

Integrals of Sines and Cosines

Last week in this blog, I discussed the Fourier series. This week, I want to highlight some remarkable mathematical formulas that make the Fourier series work: integrals of sines and cosines. The products of sine and cosines obey these relationships:
Integrals of products of sines and cosines.
where n and m are integers. In the 4th edition of Intermediate Physics for Medicine and Biology, Russ Hobbie and I dedicate Appendix E to studying these integrals. They allow some very complicated expressions involving infinite sums to reduce to elegantly simple equations for the Fourier coefficients. Whenever I’m teaching Fourier series, I go through the derivation up to the point where these integrals are needed, and then say “and now the magic happens!”

The collection of sines and cosines (sinmx, cosnx) are an example of an orthogonal set of functions. How do you prove orthogonality? One can derive it using the trigonometric product-to-sum formulas.
Several trigonometric product-to-sum formulas.
I prefer to show that these integrals are zero for some special cases, and then generalize. Russ and I do just that in Figure E2. When we plot (a) sinx sin2x and (b) sinx cosx over the range 0 to 2π, it becomes clear that these integrals are zero. We write “each integrand has equal positive and negative contributions to the total integral,” which is obvious by merely inspecting Fig. E2. Is this a special case? No. To see a few more examples, I suggest plotting the following functions between 0 and 2π:
Product of trigonometric functions to plot.
In each case, you will see the positive and negative regions cancel pairwise. It really is amazing. But don’t take my word for it, as you’ll miss out on all the fun. Try it.

Nearly as amazing is what happens when you analyze the case for m = n by integrating cosnx cosnx = cos2nx or sinnx sinnx=sin2nx. Now the integrand is a square, so it always must be positive. These integrals don’t vanish (although the “mixed” integral cosnx sinnx does go to zero). How do I remember the value of this integral? Just recall that the average value of either cos2nx or sin2nx is ½. As long as you integrate over an integral number of periods, the result is just π.

When examining non-periodic functions, one integrates over all x, rather than from merely zero to 2π. In this case, Russ and I show in Sec. 11.10 that you get delta function relationships such as
An integral representation of the delta function.
I won’t ask you to plot the integrand over x, because since x goes from negative infinity to infinity it might take you a long time.

The integrals of products of sines and cosines is one example of how Russ and I use appendicies to examine important mathematical results that might distract the reader from the main topic (in this case, Fourier series and its application to imaging), but are nevertheless important.

Friday, June 20, 2014

The Airy Disk

I hate to find errors in the 4th edition of Intermediate Physics for Medicine and Biology. When we do find any, Russ Hobbie and I let our readers know through an errata, published on the book’s website. Last week, I found another error, and it’s a particularly annoying one. First, let me tell you the error, and then I’ll fill in the backstory.

In the errata, you will now find this entry:
Page 338: In Chapter 12, Problem 10. The final equation, a Bessel function integral, should be
An integral relationship among Bessel functions.
Error found 6-10-14.
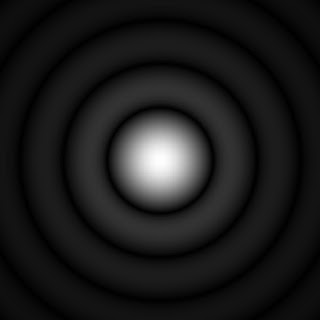
In the 4th edition, we left out the leading factor of “u” on the right-hand-side. Why does this bother me so much? In part, because Problem 10 is about a famous and important calculation. Chapter 12 is about imaging, and Problem 10 asks the reader to calculate the two-dimensional Fourier transform of the “top hat,” function equal to 1 for r less than a (a circular disk), and zero otherwise. This Fourier transform is, to within a constant factor, equal to J1(u)/u, where J1 is a Bessel function and u = ka, with k being the magnitude of the spatial frequency. This function is known as the “Airy pattern” or “Airy disk.” The picture below shows what the Airy disk looks like when plotted versus spatial frequencies kx and ky:

A plot of the Airy disk.
The Airy disk.

A picture of the square of this function is shown in Fig. 12.1 of IPMB. If you make a smaller, so the “top hat” is narrower, then in frequency space the Airy disk spreads out. Conversely, if you make a larger, so the “top hat” is wider, then in frequency space the Airy disk is more localized. The Bessel function oscillates, passing through zero many times. Qualitatively, J1(u)/u looks similar to the more familiar sinc function, sin(ka)/ka. (The sinc function appears in the Fourier transform of a rectangular “top hat” function).

The Airy disk plays a particularly important role in diffraction, a topic only marginally discussed in IPMB. Interestingly, diffraction isn’t important enough in our book even to make the index. We do mention it briefly in Chapter 13
One property of waves is that diffraction limits our ability to produce an image. Only objects larger than or approximately equal to the wavelength can be imaged effectively. This property is what limits light microscopes (using electromagnetic waves to form an image) to resolutions equal to about the wavelength of visible light, 500 nm.
We don’t talk at all about Fourier optics in IPMB. When light passes through an aperture, the image formed by Fraunhofer diffraction is the Fourier transform of the aperture function. So, for instance, when light passes through the objective lens of a microscope (or some other aperture in the optical path), the aperture function is the top hat function: all the light passes through at radii less than the radius of the lens, and no light passes through at larger radii. So the image formed by the lens of a point object (to the extent that the assumptions underlying Fraunhofer diffraction apply) is the Airy disk. Instead of a point image, you get a little blur.

Suppose you are trying to image two point objects. After diffraction, the image is two Airy disks. Can you resolve them as two separate objects? It depends on the extent of the overlap of the little blurs. Typically one uses the Rayleigh criterion to answer this question. If the two Airy disks are separated by at least the distance from the center of one Airy disk to its first zero, then the two objects are considered resolved. This is, admittedly, an arbitrary definition, but is entirely reasonable and provides a quantitative meaning to the vague term “resolved.” Thus, the imaging resolution of a microscope is determined by the zeros of the J1 Bessel function, which I find pretty neat. (I love Bessel functions).

So, you see, when I realized our homework problem had a typo and it meant the student would calculate the Airy disk incorrectly, my heart sunk. To any students who got fooled by this problem, I apologize. Mea culpa. It makes me all the more determined to keep errors out of the upcoming 5th edition, which Russ and I are working on feverishly.

On the lighter side, when I run into scientists I am not familiar with, I often look them up in Asimov’s Biographical Encyclopedia of Science and Technology. When I looked up George Biddell Airy (1801–1892), Astronomer Royal of the Greenwich Observatory, I was shocked. Asimov writes “he was a conceited, envious, small-minded man and ran the observatory like a petty tyrant.” Oh Myyy!

Friday, February 15, 2013

The Joy of X

The Joy of X,  by Steven Strogatz, superimposed on Intermediate Physics for Medicine and Biology.
The Joy of X,
by Steven Strogatz.
Steven Strogatz’s latest book is The Joy of X: A Guided Tour of Math, From One to Infinity. I have discussed books by Strogatz in previous entries of this blog, here and here. The preface defines the purpose of The Joy of X.
The Joy of X is an introduction to math’s most compelling and far-reaching ideas. The chapters—some from the original Times series [a series of articles about math that Strogatz wrote for the New York Times]—are bite-size and largely independent, so feel free to snack wherever you like. If you want to wade deeper into anything, the notes at the end of the book provide additional details, and suggestions for further reading.
My favorite chapter in The Joy of X was “Twist and Shout” about Mobius strips. Strogatz’s discussion was fine, but what I really enjoyed was the lovely video he called my attention to: “Wind and Mr. Ug”. Go watch it right now; it’s less than 8 minutes long. It is the most endearing mathematical story since Flatland.

Wind and Mr. Ug.

Of course, I’m always on the lookout for medical and biological physics, and I found it in Strogatz’s chapter called “Analyze This!,” in which he describes the Gibbs phenomenon. I have written about the Gibbs phenomenon in this blog before, but not so eloquently. Russ Hobbie and I introduce the Gibbs phenomenon in Chapter 11 of the 4th edition of Intermediate Physics for Medicine and Biology. When talking about the fit of a Fourier series to a square wave, we write
As the number of terms in the fit is increased, the value of Q [a measure of the goodness of the fit] decreases. However, spikes of constant height (about 18% of the amplitude of the square wave or 9% of the discontinuity in y) remain…These spikes appear whenever there is a discontinuity in y and are called the Gibbs phenomenon.
It turns out that the Gibbs phenomenon is related to the alternating harmonic series. Strogatz writes
Consider this series, known in the trade as the alternating harmonic series:
1 – 1/2 + 1/3 – 1/4 + 1/5 – 1/6 + … .
[…] The partial sums in this case are
S1 = 1
S2 = 1 – 1/2 = 0.500
S3 = 1 – 1/2 + 1/3 = 0.833 …
S4 = 1 – 1/2 + 1/3 – 1/4 = 0.583…

And if you go far enough, you’ll find that they home in on a number close to 0.69. The series can be proven to converge. Its limiting value is the natural logarithm of 2, denoted ln2 and approximately equal to 0.693147. […]

Let’s look at a particularly simple rearrangement whose sum is easy to calculate. Supposed we add two of the negative terms in the alternating harmonic series for every one of its positive terms, as follows:

[1 – 1/2 – 1/4] + [1/3 – 1/6 – 1/8] + [1/5 – 1/10 – 1/12] + …

Next, simplify each of the bracketed expressions by subtracting the second term from the first while leaving the third term untouched. Then the series reduces to

[1/2 – 1/4] + [1/6 – 1/8] + [1/10 – 1/12] + …

After factoring out ½ from all the fractions above and collecting terms, this becomes

½ [ 1 – 1/2 + 1/3 – 1/4 + 1/5 – 1/6 + …].

Look who’s back: the beast inside the brackets is the alternating harmonic series itself. By rearranging it, we’ve somehow made it half as big as it was originally—even though it contains all the same terms!”
Strogatz then relates this to a Fourier series

f(x) = sinx – 1/2 sin 2x + 1/3 sin 3x – 1/4 sin 4x + …

This series approaches a sawtooth curve. But when he examines its behavior with different numbers of terms in the sum, he finds the Gibbs phenomenon.
Something goes wrong near the edges of the teeth. The sine waves overshot the mark there and produce a strange finger that isn’t in the sawtooth wave itself… The blame can be laid at the doorstep of the alternating harmonic series. Its pathologies discussed earlier now contaminate the associated Fourier series. They’re responsible for that annoying finger that just won’t go away.
In the notes about the Gibbs phenomenon at the end of the book, Strogatz points us to a fascinating paper on the history of this topic
Hewitt, E. and Hewitt, R. E. (1979) “The Gibbs-Wilbraham Phenomenon: An Episode in Fourier Analysis,” Archive for the History of Exact Sciences, Volume 21, Pages129–160.
He concludes his chapter
This effect, commonly called the Gibbs phenomenon, is more than a mathematical curiosity. Known since the mid-1800s, it now turns up in our digital photographs and on MRI scans. The unwanted oscillations caused by the Gibbs phenomenon can produce blurring, shimmering, and other artifacts at sharp edges in the image. In a medical context, these can be mistaken for damaged tissue, or they can obscure lesions that are actually present.

Friday, July 8, 2011

Gasiorowicz

Quantum Physics,  by Stephen Gasiorowicz, superimposed on Intermediate Physics for Medicine and Biology.
Quantum Physics,
by Stephen Gasiorowicz.
One of the standard topics in any modern physics class is blackbody radiation. Indeed, it was the study of blackbody radiation that led to the development of quantum mechanics. In Chapter 14 of the 4th edition of Intermediate Physics for Medicine and Biology, Russ Hobbie and I write
The spectrum of power per unit area emitted by a completely black surface in the wavelength interval between λ and λ + dλ is … a universal function called the blackbody radiation function. …The description of [this] function …by Planck is one of the foundations of quantum mechanics… We can find the total amount of power emitted per unit surface area by integrating10 Eq. 14.32 [Planck’s blackbody radiation function]…[The result] is the Stefan-Boltzmann law.
As I was reading over this section recently, I was struck by the footnote number ten (present in earlier editions of our book, so I know it was originally written by Russ).
10This is not a simple integration. See Gasiorowicz (1974, p. 6).
This is embarrassing to admit, but although I am a coauthor on the 4th edition, there are still topics in our book that I am learning about. I always feel a little guilty about this, so recently I decided it is high time to take a look at the book by Stephen Gasiorowicz and see just how difficult this integral really is. The result was fascinating. The integral is not terribly complicated, but it involves a clever trick I would have never thought of. Because math is rather difficult to write in the html of this blog (at least for me), I will explain how to evaluate this integral through a homework problem. When revising our book for the 4th edition, I enjoyed finding “missing steps” in derivations and then creating homework problems to lead the reader through them. For instance, in Problem 24 of Chapter 14, Russ and I asked the reader to “integrate Eq. 14.32 over all wavelengths to obtain the Stephan-Boltzmann law, Eq. 14.33.” Then, we added “You will need the integral [integrated from zero to infinity]

∫ x3/(ex−1) dx = π4/15 .

Below is a new homework problem related to footnote ten, in which the reader must evaluate the integral given at the end of Problem 24. I base this homework problem on the derivation I found in Gasiorowicz. In our book, we cite the 1974 edition.
Gasiorowicz, S. (1974) Quantum Physics. New York, Wiley.
This is the edition in Kresge library at Oakland University, and is the one I used to create the homework problem. However, I found using amazon.com’s “look inside” feature that this derivation is also in the more recent 3rd edition (2003). In addition, I found the derivation repeated in another of Gasiorowicz’s books, The Structure of Matter.
Problem 24 ½ Evaluate the integral given in Problem 24.
(a) Factor out e−x, and then use the geometric series 1 + z + z2 + z3 + …=1/(1−z) to replace the denominator by an infinite sum.
(b) Make the substitution y = (n+1) x.
(c) Evaluate the resulting integral over y, either by looking it up or (better) by repeated integration by parts.
(d) Make the substitution m=n+1
(e) Use the fact that the sum of 1/m4 from 1 to infinity is equal to π4/90 to evaluate the integral.
Really, who would have thought to replace 1/(1−z) by an infinite series? Usually, I am desperately trying to do just the opposite: get rid of an infinite series, such as a geometric series, by replacing it with a simple function like 1/(1−z). The last thing I would have wanted to do is to introduce a dreaded infinite sum into the calculation. But it works. I must admit, this is a bit of a cheat. Even if in part (c) you don’t look up the integral, but instead laboriously integrate by parts several times, you still have to pull a rabbit out of the hat in step (e) when you sum up 1/m4. Purists will verify this infinite sum by calculating the Fourier series over the range 0 to of the function

f(x) = π4/90 – π2 x2/12 + π x3/12 – x4/48

and then evaluating it at x = 0. (Of course, you know how to calculate a Fourier series, since you have read Chapter 11 of Intermediate Physics for Medicine and Biology). When computing Fourier coefficients, you will need to do a bunch of integrals containing powers of x times cos(nx), but you can do those by—you guessed it—repeated integration by parts. Thus, even if lost on a deserted island without your math handbook or a table of integrals, you should still be able to complete the new homework problem using Gasiorowicz’s method. I’m assuming you know how to do some elementary calculus—integrate by parts and simple integrals of powers, exponentials, and trigonometric functions—without looking it up. (Full disclosure: I found the function f(x) given above by browsing through a table of Fourier series in my math handbook. On that lonely island, you would have to guess f(x), so let’s hope you at least remembered to bring along plenty of scrap paper.)

I checked out the website for Gasiorowicz’s textbook. There is a lot of interesting material there. The book covers many of the familiar topics of modern physics: blackbody radiation, the photoelectric effect, the Bohr model for hydrogen, the uncertainty principle, the Schrodinger equation and more, all the way up to the structure of atoms and molecules. I learned this material from Eisberg and Resnick’s Quantum Physics of Atoms, Molecules, Solids, Nuclei and Particles (1985), cited several times in Intermediate Physics for Medicine and Biology, when I used their book in my undergraduate modern physics class at the University of Kansas. For an undergraduate quantum mechanics class, I like Griffith’s Introduction to Quantum Mechanics, in part because I have taught from that book. But Gasiorowicz’s book appears to be in the same class as these two. I noticed that Gasiorowicz is from the University of Minnesota, so perhaps Russ knows him.

P.S. Did any of you dear readers notice that Russ and I spelled the name “Stefan” of the “Stefan-Boltzmann law” differently in the text of Chapter 14 and in Problem 24? I asked Google, and it found sites using both spellings, but the all-knowing Wikipedia favors “Stefan”. I’m not 100% certain which is correct (it may have to do with the translation from Slovene to English), but we should at least have been consistent within our book.

Friday, March 4, 2011

The Role of Magnetic Forces in Biology and Medicine

The current issue of the journal Experimental Biology and Medicine contains a minireview about “The Role of Magnetic Forces in Biology and Medicine” by yours truly (Volume 236, Pages 132–137). It fits right in with Section 8.1 (The Magnetic Force on a Moving Charge) in the 4th Edition of Intermediate Physics for Medicine and Biology. The abstract states:
The Lorentz force (the force acting on currents in a magnetic field) plays an increasingly larger role in techniques to image current and conductivity. This review will summarize several applications involving the Lorentz force, including (1) magneto-acoustic imaging of current; (2) “Hall effect” imaging; (3) ultrasonically-induced Lorentz force imaging of conductivity; (4) magneto-acoustic tomography with magnetic induction; and (5) Lorentz force imaging of action currents using magnetic resonance imaging.
The review was easy to write, because it consisted primarily of the background and significance section of a National Institutes of Health grant proposal I wrote several years ago (and which is now funded). The review describes ground-breaking work by many authors, but here I want to highlight studies by three talented undergraduate students who worked with me at Oakland University during several summers.

Kaytlin Brinker

Kayt studied a method to measure conductivity called Magneto-Acoustic Tomography with Magnetic Induction, or MAT-MI (Brinker and Roth, “The Effect of Electrical Anisotropy During Magnetoacoustic Tomography with Magnetic Induction,” IEEE Transactions on Biomedical Engineering, Volume 55, Pages1637–1639, 2008). This technique was developed by Bin He and his group at the University of Minnesota. You apply two magnetic fields, one static and one changing with time. The rapidly changing magnetic field induces eddy currents in the tissue, which then experience a Lorentz force from the static field, causing the material to move and initiating a sound wave. Measurement of the acoustic signal allows you to gain information about the conductivity distribution. Kayt’s task was to determine how anisotropy (the conductivity depends on direction) would influence MAT-MI. She “found that when imaging nerve or muscle, electrical anisotropy can have a significant effect on the acoustic signal and must be accounted for in order to obtain accurate images.”

Nancy Tseng

Nancy, who had just graduated from high school when she worked with me, analyzed a technique originally pioneered by Han Wen and then developed further by Amalric Montalibet. A sound wave is propagated through the tissue in the presence of a magnetic field. The Lorentz force causes charge separation, inducing an electrical potential and current. Measurement of the electrical signal provides information about the conductivity. Tseng looked at this effect in anisotropic tissue (Tseng and Roth, “The Potential Induced in Anisotropic Tissue by the Ultrasonically-Induced Lorentz Force,” Medical and Biological Engineering and Computing, Volume 46, Pages 195–197, 2008). She found “a novel feature of the ultrasonically-induced Lorentz force in anisotropic tissue: an oscillating electrical potential propagates along with the ultrasonic wave.” The effect has not yet been measured experimentally, but represents a fundamentally new mechanism for the induction of bioelectric signals.

Kevin Schalte

Kevin derived a tomographic method to determine tissue conductivity using the ultrasonically-induced Lorentz force (Roth and Schalte, “ Ultrasonically-Induced Lorentz Force Tomography,” Medical and Biological Engineering and Computing, Volume 47, Pages 573-577, 2009). “The strength and timing of the electric dipole caused by the ultrasonically-induced Lorentz force determines the amplitude and phase of the Fourier transform of the conductivity image. Electrical measurements at a variety of [ultrasonic] wavelengths and directions are therefore equivalent to mapping the Fourier transform of the conductivity distribution in spatial frequency space. An image of the conductivity itself is then found by taking the inverse Fourier transform.” I would never have undertaken this project had I not been a coauthor on the 4th edition of Intermediate Physics for Medicine and Biology. Only by working on the textbook did I come to fully understand and appreciate the power of tomography (see Chapter 12 on Images and Section 16.9 about Computed Tomography).

I often read about how the United States is falling behind other nations in math and science, but working with outstanding undergraduates such as these three gives me confidence that we remain competitive.

Finally, let me reproduce the all-important acknowledgments section of the minireview:
I thank Steffan Puwal and Katherine Roth [my daughter] for their comments on this manuscript. I also thank Bruce Towe, Han Wen, Amalric Montalibet and Xu Li for permission to reproduce their figures in this review. This work was supported by the National Institutes of Health grant R01EB008421.

Friday, January 15, 2021

Projections and Filtered Projections of a Square

Chapter 12 of Intermediate Physics for Medicine and Biology describes tomography. Russ Hobbie and I write

The reconstruction problem can be stated as follows. A function f(x,y) exists in two dimensions. Measurements are made that give projections: the integrals of f(x,y) along various lines as a function of displacement perpendicular to each line. For example, integration parallel to the y axis gives a function of x,
as shown in Fig. 12.12. The scan is repeated at many different angles θ with the x axis, giving a set of functions F(θ, x'), where x' is the distance along the axis at angle θ with the x axis.

One example in IPMB is the projection of a simple object: the circular top-hat

The projection can be calculated analytically

It’s independent of θ; it looks the same in every direction.

Let’s consider a slightly more complicated object: the square top-hat

This projection can be found using high school geometry and trigonometry (evaluating it is equivalent to finding the length of lines passing through the square at different angles). I leave the details to you. If you get stuck, email me (roth@oakland.edu) and I’ll send a picture of some squares and triangles that explains it.

The plot below shows the projections at four angles. For θ = 0° the projection is a rectangle; for θ = 45° it’s a triangle, and for intermediate angles (θ = 15° and 30°) it’s a trapezoid. Unlike the circular top-hat, the projection of the square top-hat depends on the direction.

The projections of a square top-hat, at different angles.

What I just described is the forward problem of tomography: calculating the projections from the object. As Russ and I wrote, usually the measuring device records projections, so you don’t have to calculate them. The central goal of tomography is the inverse problem: calculating the object from the projections. One way to perform such a reconstruction is a two-step procedure known as filtered back projection: first high-pass filter the projections and then back project them. In a previous post, I went through this entire procedure analytically for a circular top-hat. Today, I go through the filtering process analytically, obtaining an expression for the filtered projection of a square top-hat. 

Here we go. I warn you, theres lots of math. To perform the filtering, we first calculate the Fourier transform of the projection, CF(θ,k). Because the top-hat is even, we can use the cosine transform

where k is the spatial frequency.

Next, place the expression for F(θ,x') into the integral and evaluate it. Theres plenty of book-keeping, but the projection is either constant or linear in x', so the integrals are straightforward. I leave the details to you; if you work it out yourself, youll be delighted to find that many terms cancel, leaving the simple result 

To high-pass filter CF(θ,k), multiply it by |k|/2π to get the Fourier transform of the filtered projection CG(θ,k)

Finally, take the inverse Fourier transform to obtain the filtered projection G(θ,x'


Inserting our expression for CG(θ,k), we find

This integral is not trivial, but with some help from WolframAlpha I found

where Ci is the cosine integral. I admit, this is a complicated expression. The cosine integral goes to zero for large argument, so the upper limit vanishes. It goes to negative infinity logarithmically at zero argument. Were in luck, however, because the four cosine integrals conspire to cancel all the infinities, allowing us to obtain an analytical expression for the filtered projection

We did it! Below are plots of the filtered projections at four angles. 

The filtered projections of a square top-hat, at different angles.

The last thing to do is back project G(θ,x') to get the object f(x,y). Unfortunately, I see no hope of back-projecting this function analytically; its too complicated. If you can do it, let me know.

Why must we analyze all this math? Because solving a simple example analytically provides insight into filtered back projection. You can do tomography using canned computer code, but you won’t experience the process like you will by slogging through each step by hand. If you don’t buy that argument, then another reason for doing the math is: it’s fun!

Friday, November 6, 2009

Clark and Plonsey

Problem 30 in Chapter 7 of the 4th edition of Intermediate Physics for Medicine and Biology is based on a paper by John Clark and Robert Plonsey (“The Extracellular Potential of a Single Active Nerve Fiber in a Volume Conductor,” Biophysical Journal, Volume 8, Pages 842–864, 1968). This paper shows how to calculate the extracellular potential from the transmembrane potential, with results shown in our Fig. 7.13.

The calculation involves some mathematical concepts that are slightly advanced for Intermediate Physics for Medicine and Biology. First, the potentials are written in terms for their Fourier transforms. Russ Hobbie and I don’t cover Fourier analysis until Chapter 11, so the problem just assumes a sinusoidal spatial dependence. We also introduce Bessel functions for the first time in the book (to be precise, modified Bessel functions of the first and second kind). Bessel functions arise naturally when solving Laplace’s equation in cylindrical coordinates.

I have admired Clark and Plonsey’s paper for years, and was glad to see this problem introduced into the 4th edition of our book. Robert Plonsey was a professor at Case Western Reserve University from 1968-1983. He then moved to Duke University, where he was when I came to know his work while I was a graduate student. I am most familiar with his research on the bidomain model of cardiac tissue, often in collaboration with Roger Barr (e.g., “Current Flow Patterns in Two-Dimensional Anisotropic Bisyncytia with Normal and Extreme Conductivities,” Biophysical Journal, Volume 45, Pages 557–571 and “Propagation of Excitation in Idealized Anisotropic Two-Dimensional Tissue,” Biophysical Journal, Volume 45, Pages 1191–1202). Plonsey was elected as a member of the National Academy of Engineering in 1986 for “the application of electromagnetic field theory to biology, and for distinguished leadership in the emerging profession of biomedical engineering.” He retired from Duke in 1996 as the Pfizer Inc./Edmund T. Pratt Jr. University Professor Emeritus of Biomedical Engineering. He has won many awards, such as the 2000 Millennium Medal from the IEEE Engineering in Medicine and Biology Society and the 2004 Ragnar Granit Prize from the Ragnar Granit Foundation. John Clark is currently a Professor of Electrical and Computer Engineering at Rice University. He is a Life Fellow in the Institute of Electrical and Electronics Engineers (IEEE) “for contributions to modeling in electrophysiology and cardiopulmonary systems.”

One of my earliest papers was an extension of Clark and Plonsey’s model to a strand of cardiac tissue, using the bidomain model (“A Bidomain Model for the Extracellular Potential and Magnetic Field of Cardiac Tissue,” IEEE Transactions of Biomedical Engineering, Volume 33, Pages 467–469, 1986.) The mathematics is almost the same as in their paper—Fourier transforms and Bessel functions—but the difference is that I modeled a multicellular strand of tissue, like a papillary muscle in the heart, that contains of both intracellular and interstitial spaces (the two domains of the “bidomain” model). A comparison of my paper to Clark and Plonsey’s earlier work indicates how influential their research was on my early development as a scientist. They were cited in the first sentence of my paper.

Friday, July 24, 2015

So You Don’t Like Error Functions?

In Chapter 4 of the 5th edition of Intermediate Physics for Medicine and Biology, Russ Hobbie and I introduce the diffusion equation (Equation 4.26)
The one dimensional diffusion equation.
where C is the concentration and D is the diffusion constant. We then study one-dimensional diffusion where initially (t = 0) the region to the left of x = 0 has a concentration Co, and the region to the right has a concentration of zero (Section 4.13). We show that the solution to the diffusion equation is (Equation 4.75)
A solution of the diffusion equation involving an error function.
where erf is the error function.

Some students don’t like error functions (really?). Moreover, often we can gain insight by solving a problem in several ways, obtaining solutions that are seemingly different yet equivalent. Let’s see if we can solve this problem in another way and avoid those pesky error functions. We will use a standard method for solving partial differential equations: separation of variables. Before I start, let’s agree to solve a slightly different problem: initially C(x,0) is Co/2 for x less than zero, and −Co/2 for x greater than zero. I do this so the solution will be odd in x: C(x,t) = −C(−x,t). At the end we can add the constant Co/2 and get back to our original problem. Now, let’s begin.

Assume the solution can be written as the product of a function of only t and a function of only x: C(x,t) = T(t) X(x). Plug this into the diffusion equation, simplify, and divide both sides by TX 
The method of separation of variables applied to the diffusion equation.
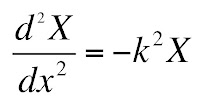
The only way that the left and right hand sides can be equal at all values of x and t is if both are equal to a constant, which I will call −k2. This gives two ordinary differential equations
The equation for the temporal part of the diffusion equation after separation of variables.
 and
The solution to the first equation is an exponential
The solution to the equation for the temporal part of the diffusion equation after separation of variables.
and the solution to the second is a sine
The solution to the equation for the spatial part of the diffusion equation after separation of variables.
There is no cosine term because of the odd symmetry. Unfortunately, we don’t know the value of k. In fact, our solution can be a superposition of infinitely many values of k
A solution to the diffusion equation in integral form.
where A(k) specifies the weighting.

To determine A(k), use the Fourier techniques developed in Chapter 11. The result is
The Fourier transform of the solution to the diffusion equation in integral form.
How did I get that? Let me outline the process, leaving you to fill in the missing steps. I should warn you that a mathematician would worry about the convergence of the integrals we evaluate, but you and I’ll brush those concerns under the rug.

At t = 0, our solution becomes
Except for a missing factor of 2π, this looks just like the Fourier transform from Section 11.9 of IPMB. Next, multiply each side of the equation by sin(ωx), and integrate over all x. Then, use Equation 11.66b to express the integral of the product of sines as a delta function. You get
Both C(x,0) and sin(kx) are odd, so their product is even, and for x greater than zero C(x,0) is −Co/2. Therefore,
You know how to integrate sine (I hope you do!), so
Here is where things get dicey. We don’t know what cosine equals at infinity, but if we say it averages to zero the first term goes away and we get our result
Plugging in this expression for A(k) gives our solution for C(x,t). If we want to go back to our original problem with an initial condition of Co on the left and zero on the right, we must add Co/2. Thus
A solution of the one dimensional diffusion equation without error functions.
Let’s compare this solution with the one in Equation 4.75 (given above). Our new solution does not contain the error function! Those of you who dislike that function can celebrate. Unfortunately, we traded the error function for an integral that we can’t evaluate in closed form. So, you can have a function that you may be unfamiliar with and that has a funny name, or you can have an expression with common functions like the sine and the exponential inside an integral. Pick your poison.