Friday, August 30, 2024

Joe Redish (1943–2024)

Edward “Joe” Redish, a University of Maryland physics professor, died August 24 of cancer. Joe has been mentioned many times in this blog (here, here, here, and here). He was deeply interested in how students—and in particular biology students—learn physics, an interest with obvious relevance to Intermediate Physics for Medicine and Biology.

Redish, E. F.,  “Using Math in Physics: 7. Telling the Story,” Phys. Teach., 62: 5–11, 2024, on the cover of Intermediate Physics for Medicine and Biology.
Redish, E. F., 
“Using Math in Physics: 7. Telling the Story,”
Phys. Teach.
, 62: 5–11, 2024.
I knew Joe, and valued his friendship. Rather than writing about him myself,  I’ll share some of his thoughts in his own words. He had a wonderful series of papers in The Physics Teacher about using math in physics. The last of the series (published this year) was about using math to tell a story (Redish, E. F., “Using Math in Physics: 7. Telling the Story,” Phys. Teach., Volume 62, Pages 5–11, 2024). He wrote

Even if students can make the blend—interpret physics correctly in mathematical symbology and graphs—they still need to be able to apply that knowledge in productive and coherent ways. As instructors, we can show our solutions to complex problems in class. We can give complex problems to students as homework. But our students are likely to still have trouble because they are missing a key element of making sense of how we think about physics: How to tell the story of what’s happening.

We use math in physics differently than it’s used in math classes. In math classes, students manipulate equations with abstract symbols that usually have no physical meaning. In physics, we blend conceptual physics knowledge with mathematical symbology. This changes the way that we use math and what we can do with it.

We use these blended mental structures to create stories about what’s happening (mechanism) and stabilize them with fundamental physical laws (synthesis).
In an oral history interview with the American Institute of Physics, Joe talked about using simple toy models when teaching physics to biology students.
One of the problems that students run into, that teachers of physics run into teaching biology students, is we use all these trivial toy models, right? Frictionless vacuum. Ignore air resistance. Treat it as a point mass. And the biology students come in and they look at this and they say, “These are not relevant. This is not the real world.” And they know in biology, that if you simplify a system, it dies. You can’t do that. In physics we do this all the time. Simple models are kind of a core epistemological resource for us. You find the simplest example you possibly can and you beat it to death. It illustrates the principle. Then you see how the mathematics goes with the physics. The whole issue of finding simple models is where a lot of the creative art is in physics.
Redish and Cooke, “Learning Each Other’s Ropes: Negotiating Interdisciplinary Authenticity” CBE—Life Sciences Education, 12:175–186, 2013, on the cover of Intermediate Physics for Medicine and Biology.
Redish and Cooke,
Learning Each Other’s Ropes:
Negotiating Interdisciplinary Authenticity

CBE—Life Sciences Education
,
12:175–186, 2013.
My favorite of Joe’s papers is “Learning Each Other’s Ropes: Negotiating Interdisciplinary Authenticity” which he coauthored with biologist Todd Cooke (CBE—Life Sciences Education, Volume 12, Pages 175–186, 2013).
From our extended conversations, both with each other and with other biologists, chemists, and physicists, we conclude that, “science is not just science.” Scientists in each discipline employ a tool kit of different types of scientific reasoning. A particular discipline is not characterized by the exclusive use of a set of particular reasoning types, but each discipline is characterized by the tendency to emphasize some types more than others and to value different kinds of knowledge differently. The physicist’s enthusiasm for characterizing an object as a disembodied point mass can make a biologist uncomfortable, because biologists find in biology that function is directly related to structure. Yet similar sorts of simplified structures can be very powerful in some biological analyses. The enthusiasm that some biologists feel toward our students learning physics is based not so much on the potential for students to learn physics knowledge, but rather on the potential for them to learn the types of reasoning more often experienced in physics classes. They do not want their students to think like physicists. They want them to think like biologists who have access to many of the tools and skills physicists introduce in introductory physics classes… We conclude that the process is significantly more complex than many reformers working largely within their discipline often assume. But the process of learning each other’s ropes—at least to the extent that we can understand each other’s goals and ask each other challenging questions—can be both enlightening and enjoyable. And much to our surprise, we each feel that we have developed a deeper understanding of our own discipline as a result of our discussions.

You can listen to Joe talk about physics education research on the Physics Alive podcast.

We’ll miss ya, Joe.

Friday, August 23, 2024

The Song of the Dodo

The Song of the Dodo,
by David Quammem.
One of my favorite science writers is David Quammen. I’ve discussed several of his books in this blog before, such as Breathless, Spillover, and The Tangled Tree. A copy of one of his earlier books—The Song of the Dodo: Island Biogeography in an Age of Extinctions—has sat on my bookshelf for a while, but only recently have I had a chance to read it. I shouldn’t have waited so long. It’s my favorite.

Quammen is not surprised that the central idea of biology, natural selection, was proposed by two scientists who studied islands: Charles Darwin and the Galapagos, and Alfred Russell Wallace and the Malay Archipelago. The book begins by telling Wallace’s story. Quammen calls him “the man who knew islands.” Wallace was the founder of the science of biogeography: the study of how species are distributed throughout the world. For example, Wallace’s line lies between two islands in Indonesia that are only 20 miles apart: Bali (with plants and animals similar to those native to Asia) and Lombok (with flora and fauna more like that found in Australia). Because islands are so isolated, they are excellent laboratories for studying speciation (the creation of new species through evolution) and extinction (the disappearance of existing species).

Quammen is the best writer about evolution since Stephen Jay Gould. I would say that Gould was better at penning essays and Quammen is better at authoring books. Much of The Song of the Dodo deals with the history of science. I would rank it up there with my favorite history of science books: The Making of the Atomic Bomb by Richard Rhodes, The Eighth Day of Creation by Horace Freeland Judson, and The Maxwellians by Bruce Hunt.

Yet, The Song of the Dodo is more than just a history. It’s also an amazing travelogue. Quammen doesn’t merely write about islands. He visits them, crawling through rugged jungles to see firsthand animals such as the Komodo Dragon (a giant man-eating lizard), the Madagascan Indri (a type of lemur), and the Thylacine (a marsupial also known as the Tasmanian tiger). A few parts of The Song of the Dodo are one comic sidekick away from sounding like a travel book Tony Horwitz might have written. Quammen talks with renowned scientists and takes part in their research. He reminds me of George Plimpton, sampling different fields of science instead of trying out various sports.

Although I consider myself a big Quammen fan, he does have one habit that bugs me. He hates math and assumes his readers hate it too. In fact, if Quammen’s wife Betsy wanted to get rid of her husband, she would only need to open Intermediate Physics for Medicine and Biology to a random page and flash its many mathematical equations in front of his face. It would put him into shock, and he probably wouldn’t last the hour. In his book, Quammen only presents one equation and apologizes profusely for it. It’s a power law relationship

S = c An .

This is the same equation that Russ Hobbie and I analyze in Chapter 2 of IPMB, when discussing log-log plots and scaling. How do you determine the dimensionless exponent n for a particular case? As is my wont, I’ll show you in a new homework problem.
Section 2.11

Problem 40½. In island biogeography, the number of species on an island, S, is related to the area of the island, A, by the species-area relationship: S = c An, where c and n are constants. Philip Darlington counted the number of reptile and amphibian species from several islands in the Antilles. He found that when the island area increased by a factor of ten, the number of species doubled. Determine the value of n.
Let me explain to mathaphobes like Quammen how to solve the problem. Assume that on one island there are S0 species and the area is A0. On another island, there are 2S0 species and an area of 10A0. Put these values into the power law to find S0 = cA0n and 2S0 = c(10A0)n. Now divide the second equation by the first (c, S0, and A0 all cancel) to find 2 = 10n. Take the logarithm of both sides, so log(2) = log(10n), or using a property of logarithms log(2) = n log(10). So n = log(2)/log(10) = 0.3. Note that n is positive, as it should be since increasing the area increases the number of species.

When I finished the main text of The Song of the Dodo, I thumbed through the glossary and found an entry for logarithm. “Aww,” I thought, “Quammen was only joking; he likes math after all.” Then I read his definition: “logarithm. A mathematical thing. Never mind.”

About halfway through, the book makes a remarkable leap from island biogeography—interesting for its history and relevance to exotic tropical isles—to mainland ecology, relevant to critical conservation efforts. Natural habitats on the continents are being broken up into patches, a process called fragmentation. The expansion of towns and farms creates small natural reserves surrounded by inhospitable homes and fields. The few remaining native regions tend to be small and isolated, making them similar to islands. A small natural reserve cannot support the species diversity that a large continent can (S = c An). Extinctions inevitably follow.

The Song of the Dodo also provides insight into how science is done. For instance, the species-area relationship was derived by Robert MacArthur and Edward Wilson. While it’s a valuable contribution to island biogeography, scientists disagree on its applicability to fragmented continents, and in particular they argue about its relevance to applied conservation. Is a single large reserve better than several small ones? In the 1970s a scientific battle raged, with Jared Diamond supporting a narrow interpretation of the species-area relationship and Dan Simberloff advocating for a more nuanced and less dogmatic view. As in any science, the key is to get data to test your hypothesis. Thomas Lovejoy performed an experiment in the Amazon to test the species-area relationship. Parts of the rainforest were being cleared for agriculture or other uses, but the Brazilian government insisted on preserving some of the native habitat. Lovejoy obtained permission to create many different protected rainforest reserves, each a different size. His team monitored the reserves before and after they became isolated from adjacent lands, and tracked the number of species supported in each of these “islands” over time. While the results are complicated, there is a correlation between species diversity and reserve size. Area matters.

One theme that runs through the story is extinction. If you read the book, you better have your hanky ready when you reach the part where Quammen imagines the death of the last Dodo bird. Conservation efforts are featured throughout the text, such as the quest to save the Mauritius kestrel.  
 
The Song of the Dodo concludes with a mix of optimism and pessimism. Near the end of the book, when writing about his trip to Aru (an island in eastern Indonesia) to observe a rare Bird of Paradise, Quammen writes
The sad, dire things that have happened elsewhere, in so many parts of the world—biological imperialism, massive habitat destruction, fragmentation, inbreeding depression, loss of adaptability, decline of wild populations to unviable population levels, ecosystem decay, trophic cascades, extinction, extinction, extinction—haven’t yet happened here. Probably they soon will. Meanwhile, though, there’s still time. If time is hope, there’s still hope.

An interview with David Quammen, by www.authorsroad.com

https://www.youtube.com/watch?v=Quq7PNH1zWM

Friday, August 16, 2024

Happy 100th Birthday Robert Adair

Are Electromagnetic Fields
Making Me Ill?

This Wednesday will be the 100th anniversary of Robert Adair’s birth. I wrote a blog post about Adair recently but he is an important enough figure in biological physics, and in Intermediate Physics for Medicine and Biology, that today I will write about him again. This time I will focus on a difference of opinion between Adair and Joseph Kirschvink about the possible effects of weak electric and magnetic fields in biology. In Are Electromagnetic Fields Making Me Ill? I wrote
One of the first physicists to enter the fray [over the potential hazards of powerline magnetic fields] was Yale physics professor Robert Adair, a member of the National Academy of Sciences who was known for his research on elementary particles called kaons and for his interest in the physics of baseball. In 1991, Adair published an article in the leading physics journal Physical Review investigating the possible mechanisms by which 60-Hz electric and magnetic fields could affect organisms…. Adair concluded that “there are very good reasons to believe that weak [extremely low frequency] fields can have no significant biological effect at the cell level—and no strong reason to believe otherwise” [10].
“Constraints on Biological Effects
of Weak Extremely-Low-Frequency
Electromagnetic Fields”

Reference 10 is
R. Adair, “Constraints on Biological Effects of Weak Extremely-Low-Frequency Electromagnetic Fields,” Physical Review A, Volume 43, Pages 1039–1048, 1991
Kirschvink responded (“Comment on ‘Constraints on biological effects of weak extremely-low-frequency electromagnetic fields.’” Physical Review A, Volume 46. Pages 2178–2184, 1992)
In a recent paper, Adair [Phys. Rev. A 43, 1039 (1991)] concludes that weak extremely-low-frequency (ELF) electromagnetic fields cannot affect biology on the cell level. However, Adair's assertion that few cells of higher organisms contain magnetite (Fe3O4) and his blanket denial of reproducible ELF effects on animals are both wrong. Large numbers of single-domain magnetite particles are present in a variety of animal tissues, including up to a hundred million per gram in human brain tissues, organized in clusters of tens to hundreds of thousand per gram. This is far more than a "few cells." Similarly, a series of reproducible behavioral experiments on honeybees, Apis mellifera, have shown that they are capable of responding to weak ELF magnetic fields that are well within the bounds of Adair s criteria. A biologically plausible model of the interaction of single-domain magnetosomes with a mechanically activated transmembrane ion channel shows that ELF fields on the order of 0.1 to 1 mT are capable of perturbing the open-closed state by an energy of kT. As up to several hundred thousand such structures could fit within a eukaryotic cell, and the noise should go as the square root of the number of independent channels, much smaller ELF sensitivities at the cellular level are possible. Hence, the credibility of weak ELF magnetic effects on living systems must stand or fall mainly on the merits and reproducibility of the biological or epidemiological experiments that suggest them, rather than on dogma about physical implausibility.
In his comment, Kirschvink proposed a model of a magnetosome interacting with the earth’s magnetic field that Russ Hobbie and I discuss in Section 9.10 of Intermediate Physics for Medicine and Biology.

What do you think about Kirschvink’s claim that magnetite is found in the human brain? In Are Electromagnetic Fields Making Me Ill? I wrote
Caltech geophysicist Joseph Kirschvink has found magnetite in the brain, which could be the basis of magnetoreception in humans [12]. Experiments to test this hypothesis are difficult; contamination of tissue samples is always a problem, and the mere presence of magnetite does not by itself imply that a magnetic sensor exists.

[12] J. L. Kirschvink, A. Kobayashi-Kirschvink, B. J. Woodford, “Magnetite Biomineralization in the Human Brain,” Proceedings of the National Academy of Sciences, Volume 89, Pages 7683–7687, 1992.
The last sentence of Kirschvink’s abstract particularly interests me: “Hence, the credibility of weak ELF magnetic effects on living systems must stand or fall mainly on the merits and reproducibility of the biological or epidemiological experiments that suggest them, rather than on dogma about physical implausibility.” In one sense it is a truism. Yes, of course, experiments are the final deciding factor in scientific truth. Yet, I’m uncomfortable about characterizing Adair’s analysis as “dogma about physical implausibility.” Adair’s work was based on very basic physics. I suppose you could call Maxwell’s equations and the three laws of thermodynamics “dogma,” but it is a pretty credible dogma.

More recently, Sheraz Khan and David Cohen published a fascinating study about “Using the Magnetoencephalogram to Noninvasively Measure Magnetite in the Living Human Brain” (Human Brain Mapping, Volume 40, Pages 1654–1665, 2019). They observed magnetite primarily in older men, and suggest that magnetite may play a role in neurodegenerative diseases, such as Alzheimers.

Adair published a reply (R. K. Adiar, “Reply to ‘Comment on “Constraints on Biological Effects on Weak Extremely-Low-Frequency Electromagnetic Fields,”’” Physical Review A, Volume 46, Pages 2185–2187, 1992). His abstract says:
Kirschvink [preceding Comment, Phys. Rev. A 46, 2178 (1992)] objects to my conclusions [Phys. Rev. A 43, 1039 (1991)] that weak extremely-low-frequency (ELF) electromagnetic fields cannot affect biology on the cell level. He argues that I did not properly consider the interaction of such fields with magnetite (Fe3O4) grains in cells and that such interactions can induce biological effects. However, his model, designed as a proof of principle that the interaction of weak 60-Hz ELF fields with magnetite domains in a cell can affect cell biology, requires, by his account, a magnetic field of 0.14 mT (1400 mG) to operate, while my paper purported to demonstrate only that fields smaller than 0.05 mT (500 mG) must be ineffective. I then discuss ELF interactions with magnetite generally and show that the failure of Kirschvink s model to respond to weak fields must be general and that no plausible interaction with biological magnetite of 60-Hz magnetic fields with a strength less than 0.05 mT can affect biology on the cell level.
I tend to side with Adair’s position in his reply; I, too, am skeptical of weak-field magnetic effects in biology. However, the controversy makes me wonder if magnetic resonance imaging interacting with magnetite in the brain might possibly trigger some sort of effect, especially in the newer high-magnetic-field scanners. The magnetic field in a 4-tesla MRI machine is nearly 105 stronger than the 0.05 mT field of the earth that Adair and Kirschvink are arguing about. I still remain skeptical about MRI effects (see Chapter 2 in Are Electromagnetic Fields Making Me Ill?), but at least this seems to be a more plausible mechanism than interactions with the earth’s magnetic field.

Several important figures in physics applied to medicine and biology were born in 1924: Allan Cormack, Bernard Cohen, Robert Plonsey, and Robert Adair. This week we wish Adair a happy 100th birthday. His work on the effect of weak electric and magnetic fields in biology remains relevant today. I wish he was here to see the latest results.

Friday, August 9, 2024

A Comparison of Two Models for Calculating the Electrical Potential in Skeletal Muscle

Roth and Gielen,
Annals of Biomedical Engineering,
Volume 15, Pages 591–602, 1987
Today I want to tell you how Frans Gielen and I wrote the paper “A Comparison of Two Models for Calculating the Electrical Potential in Skeletal Muscle” (Annals of Biomedical Engineering, Volume 15, Pages 591–602, 1987). It’s not one of my more influential works, but it provides insight into the kind of mathematical modeling I do.

The story begins in 1984 when Frans arrived as a post doc in John Wikswo’s Living State Physics Laboratory at Vanderbilt University in Nashville. Tennessee. I had already been working in Wikswo’s lab since 1982 as a graduate student. Frans was from the Netherlands and I called him “that crazy Dutchman.” My girlfriend (now wife) Shirley and I would often go over to Frans and his wife Tiny’s apartment to play bridge. I remember well when they had their first child, Irene. We all became close friends, and would go camping in the Great Smoky Mountains together.

Frans had received his PhD in biophysics from Twente University. In his dissertation he had developed a mathematical model of the electrical conductivity of skeletal muscle. His model was macroscopic, meaning it represented the electrical behavior of the tissue averaged over many cells. It was also anisotropic, so that the conductivity was different if measured parallel or perpendicular to the muscle fiber direction. His PhD dissertation also reported many experiments he performed to test his model. He used the four-electrode method, where two electrodes pass current into the tissue and two others measure the resulting voltage. When the electrodes are placed along the muscle fiber direction, he found that the resulting conductivity depended on the electrode separation. If the current-passing electrodes where very close together then the current was restricted to the extracellular space, resulting in a low conductivity. If, however, the electrodes were farther apart then the current would distribute between the extracellular and intracellular spaces, resulting in a high conductivity.

When Frans arrived at Vanderbilt, he collaborated with Wikswo and me to revise his model. It seemed odd to have the conductivity (a property of the tissue) depend on the electrode separation (a property of the experiment). So we expressed the conductivity using Fourier analysis (a sum of sines and cosines of different frequencies), and let the conductivity depended on the spatial frequency k. Frans’s model already had the conductivity depend on the temporal frequency, ω, because of the muscle fiber’s membrane capacitance. So our revised model had the conductivity σ be a function of both k and ωσ = σ(k,ω). Our new model had the same behavior as Fran’s original one: for high spatial frequencies the current remained in the extracellular space, but for low spatial frequencies it redistributed between the extracellular and intracellular spaces. The three of us published this result in an article titled “Spatial and Temporal Frequency-Dependent Conductivities in Volume-Conduction Calculations for Skeletal Muscle” (Mathematical Biosciences, Volume 88, Pages 159–189, 1988; the research was done in January 1986, although the paper wasn’t published until April of 1988).

Meanwhile, I was doing experiments using tissue from the heart. My goal was to calculate the magnetic field produced by a strand of cardiac muscle. Current could flow inside the cardiac cells, in the perfusing bath surrounding the strand, or in the extracellular space between the cells. I was stumped about how to incorporate the extracellular space until I read Les Tung’s PhD dissertation, in which he introduced the “bidomain model.” Using this model and Fourier analysis, I was able to derive equations for the magnetic field and test them in a series of experiments. Wikswo and I published these results in the article “A Bidomain Model for the Extracellular Potential and Magnetic Field of Cardiac Tissue” (IEEE Transactions of Biomedical Engineering, Volume 33, Pages 467–469, 1986).

By the summer of 1986 I had two mathematical models for the electrical conductivity of muscle. One was a “monodomain” model (representing an averaging over both the intracellular and extracellular spaces) and one was a “bidomain” model (in which the intracellular and extracellular spaces were each individually averaged over many cells). It was strange to have two models, and I wondered how they were related. One was for skeletal muscle, in which each muscle cell is long and thin but not coupled to its neighbors. The other was for cardiac muscle, which is a syncytium where all the cells are coupled through intercellular junctions. I can remember going into Frans’s office and grumbling that I didn’t know how these two mathematical representations were connected. As I was writing the equations for each model on his chalkboard, it suddenly dawned on me that the main difference between the two models was that for cardiac tissue current could flow perpendicular to the fiber direction by passing through the intercellular junctions, whereas for skeletal muscle there was no intracellular path transverse to the uncoupled fibers. What if I took the bidomain model for cardiac tissue and set the transverse, intracellular conductivity equal to zero? Wouldn’t that, in some way, be equivalent to the skeletal muscle model?

I immediately went back to my own office and began to work out the details. This calculation starts on page 85 of my Vanderbilt research notebook #15, dated June 13, 1986. There were several false starts, work scratched out, and a whole page crossed out with a red pen. But by page 92 I had shown that the frequency-dependent conductivity model for skeletal muscle was equivalent to the bidomain model for cardiac muscle if I set the bidomain transverse intracellular conductivity to zero, except for one strange factor that included the membrane impedance, which represented current traveling transverse to the skeletal muscle fibers by shunting across the cell membrane. But this extra factor was important only at high temporal frequencies (when capacitance shorted out the membrane) and otherwise was negligible. I proudly marked the end of my analysis with “QED” (quod erat demonstrandum; Latin for “that which was to be demonstrated,” which often appears at the end of a mathematical proof).

Two pages (85 and 92) from my Research Notebook #15 (June, 1986).

Frans and I published this result in the Annals of Biomedical Engineering, and it is the paper I cite at the top of this blog post. Wikswo was not listed as an author; I think he was traveling that summer, and when he returned to the lab we already had the manuscript prepared, so he let us publish it just under our names. The abstract is given below:

We compare two models for calculating the extracellular electrical potential in skeletal muscle bundles: one a bidomain model, and the other a model using spatial and temporal frequency-dependent conductivities. Under some conditions the two models are nearly identical, However, under other conditions the model using frequency-dependent conductivities provides a more accurate description of the tissue. The bidomain model, having been developed to describe syncytial tissues like cardiac muscle, fails to provide a general description of skeletal muscle bundles due to the non-syncytial nature of skeletal muscle.

Frans left Vanderbilt in December, 1986 and took a job with the Netherlands section of the company Medtronic, famous for making pacemakers and defibrillators. He was instrumental in developing their deep brain stimulation treatment for Parkinson’s disease. I graduated from Vanderbilt in August 1987, stayed for one more year working as a post doc, and then took a job at the National Institutes of Health in Bethesda, Maryland.

Those were fun times working with Frans Gielen. He was a joy to collaborate with. I’ll always remember than June day when—after brainstorming with Frans—I proved how those two models were related.

Short bios of Frans and me published in an article with Wikswo in the IEEE Trans. Biomed. Eng.,
cited on page 237 of Intermediate Physics for Medicine and Biology.
 

Friday, August 2, 2024

If I Understood You, Would I Have This Look on My Face?

I’m a big Alan Alda fan. As a teenager, I would watch him each week as Hawkeye Pierce on M*A*S*H. Besides being an actor, Alda also had a second career as a science communicator, hosting the PBS series Scientific American Frontiers.

The cover of If I Understood You, Would I Have This Look on My Face? superimposed on Intermediate Physics for Medicine and Biology.
If I Understood You, Would
I Have This Look on My Face?

by Alan Alda.
After writing this science blog for seventeen years, I’ve decided I should try to figure out what I’m doing. So I read Alda’s book If I Understood You, Would I Have This Look on My Face? My Adventures in the Art and Science of Relating and Communicating. In his introduction, Alda writes
You run a company and you think you are relating to your customers and employees, and that they understand what you’re saying, but they don’t, and both customers and employees are leaving you. You’re a scientist who can’t get funded because the people with the money just can’t figure out what you’re telling them. You’re a doctor who reacts to a needy patient with annoyance; or you love someone who finds you annoying, because they just don’t get what you’re trying to say.

But it doesn’t have to be that way.

For the last twenty years, I’ve been trying to understand why communicating seems so hard—especially when we’re trying to communicate something weighty and complicated. I started with how scientists explain their work to the public: I helped found the Center for Communicating Science at Stony Brook University in New York, and we’ve spread what we learned to universities and medical schools across the country and overseas.

But as we helped scientists be clear to the rest of us, I realized we were teaching something so fundamental to communication that it affects not just how scientists communicate, but the way all of us relate to one another.

We were developing empathy and the ability to be aware of what was happening in the mind of another person.
The first half of the book describes a variety of improvisation techniques that teach how to increase your empathy and your ability connect to others; almost how to read someone’s mind. Alda believes that empathy is the key to communicating: “relating is everything.”

While I find these ideas interesting, improvisation isn’t something I have any experience with and, frankly, have little interest in trying. After all, most of these methods require interpreting facial expressions and body language. What could any of this have to do with the solitary process of writing a blog post?

Then I reached Chapter 15: “Reading the Mind of the Reader.” It starts
I know it sounds odd, but we’ve found that it’s possible to have an inkling of what’s going on in the mind of our audience even when they’re not actually in the room with us—like when we write.
I wish this chapter had been longer. Alda stresses the importance of writing from the reader’s perspective
In his elegant book The Sense of Style, Steven Pinker says that to write as if the reader were looking over your shoulder is probably to not possible. It’s just too difficult to take on the perspective of another person.

I wonder...
He then describes Steven Strogatz’s success in writing about mathematics, and how he “engages the reader as a friend.” Readers of my blog might be familiar with Strogatz, whose work I have discussed before (here, here, here, and here). Alda concludes this chapter about writing with
My guess is that even in writing, respecting the other person’s experience gives us our best shot at being clear and vivid, and our best shot, if not at being loved, at least at being understood.
Another technique to improve a scientist’s writing is to tell stories. The secret is to first introduce the main character and their goal. For a scientist, this may be to test a hypothesis. Then, crucially, comes some obstacle that puts everything in suspense. Finally, some turning point arises and the story resolves. Alda claims that a story is engaging because you get “caught up in someone's struggle to achieve something.”
If we’re looking for a way to bring emotion to someone, a story is the perfect vehicle. We can’t resist stories. We crave them.
I’m going to try to incorporate more empathy and story-telling into these blog posts. An even greater challenge will be to use these techniques in a textbook like Intermediate Physics for Medicine and Biology as we prepare the 6th edition. My years of experience teaching undergraduates based on IPMB should help. I’ll do my best.

I’ll let Alda have the last word.
So, it’s really not that complicated: If your read my face, you’ll see if I understand you. Improv games, and even exercises on your own, can bring you in touch with the inner life of another person—even when you sit by yourself and write.


Alan Alda on If I Understood You, Would I Have This Look on My Face?

https://www.youtube.com/watch?v=y8xPr6fJRMs 


Alan Alda on why communication is so important to science.

https://www.youtube.com/watch?v=abr6CqbNdM4

Friday, July 26, 2024

Why Does Inductance Not Play a Bigger Role in Biology?

In this blog, I talk a lot about topics discussed in Intermediate Physics for Medicine and Biology. Almost as interesting is what topics are NOT discussed in IPMB. One example is inductance.

It’s odd that inductance is not examined in more detail in IPMB, because it is one of my favorite physics topics. To be fair, Russ Hobbie and I do discuss electromagnetic induction: how a changing magnetic field induces an electric field and consequently creates eddy currents. That process underlies transcranial magnetic stimulation, and is analyzed extensively in Chapter 8. However, what I want to focus on today is inductance: the constant of proportionality relating a changing current (I) and an induced electromotive force (; it’s similar to a voltage, although there are subtle differences). The self-inductance of a circuit element is usually denoted L, as in the equation

             = - L dI/dt .

The word “inductance” appears only twice in IPMB. When deriving the cable equation of a nerve axon, Russ and I write
This rather formidable looking equation is called the cable equation or telegrapher’s equation. It was once familiar to physicists and electrical engineers as the equation for a long cable, such as a submarine cable, with capacitance and leakage resistance but negligible inductance.

Joseph Henry
Joseph Henry
(1797–1878)

Then, in Homework Problem 44 of Chapter 8, Russ and I ask the reader to calculate the mutual inductance between a nerve axon and a small, toroidal pickup coil. The mutual inductance between two circuit elements can be found by calculating the magnetic flux threading one element divided by the current in the other element. This means the units of inductance are tesla meter squared (flux) over ampere (current), which is given the nickname the henry (H), after American physicist Joseph Henry.

The inductance plays a key role in some biomedical devices. For example, during transcranial magnetic stimulation a magnetic stimulator passes a current pulse through a coil held near the head, inducing an eddy current in the brain. The self-inductance of the coil determines the rate of rise of the current pulse. Another example is the toroidal pickup coil mentioned earlier, where the mutual inductance is the magnetic flux induced in the coil divided by the current in an axon.

Interestingly, the magnetic permeability, μ0, is related to the inductance. In fact, the units of μ0 can be expressed in henries per meter (H/m, an inductance per unit length). If you are using a coaxial cable in an electrical circuit to make electrophysiological measurements, the inductance introduced by the cable is equal to μ0 times the length of the cable times a dimensionless factor that depends on things like the geometry of the cable.

In a circuit, the inductance will induce an electromotive force that opposes a change in the current; It’s a conservative process that acts to keep the current from easily changing. It’s the electrical analogue to mechanical inertia. An inductor sometimes acts like a “choke,” preventing high frequency current from passing through a circuit (say, a few microsecond long spike caused by a nearby lighting strike) while having little effect on the low frequency current (say, the 60 Hz current associated with our power distribution system). You can use inductors to create high- and low-pass filters (although capacitors are more commonly used nowadays).

Why do inductors play such a small role in biology? The self-inductance of a circuit is typically equal to μ0 times ℓ, where ℓ is a characteristic distance, so Lμ0ℓ. What can you do to make the inductance larger? First, you could use iron or some other material with a large magnetic permeability, so instead of the magnetic permeability being μ0 (the permeability of free space) it is μ (which can be many thousands of times larger than μ0). Another way to increase the inductance is to wind a conductor with many (N) turns  of wire. The self-inductance generally increases as N2. Finally, you can just make the circuit larger (increase ℓ). However, biological materials contain little or no iron or other ferromagnetic materials, so the magnetic permeability is just μ0. Rarely do you find lots of turns of wire (some would say the myelin wrapping around a nerve axon is a biological example with large N, but there is little evidence that current flows around the axon within the myelin sheath). And most electrical circuits are small (say, on the order of millimeters or centimeters). If we take the permeability of biological tissue (4π × 10-7 H/m) times a size of 10 cm (0.1 m) you get an inductance of about 10-7 H. That’s a pretty small inductance.

Why do I say that 10-7 H is small? Let’s calculate the induced electromotive force by a current changing in a circuit. Most biological currents are small (John Wikswo and I measured currents of a microamp in a large crayfish nerve axon, and rarely are biological currents larger than this). They also don’t change too rapidly. Nerves work on a time scale on the order of a millisecond. So the magnitude of the induced electromotive force is

             = L dI/dt = (10-7 H) (10-6 A)/(10-3 s) = 10-10 V.

Nerves work using voltages on the order of tens or hundreds of millivolts. So, the induced electromotive force is a thousand million times too small to affect nerve conduction. Sure, some of my assumptions might be too conservative, but even if you find a trick to make a thousand times larger, it is still a million times too small to be important. 

There is one more issue. An electrical circuit with inductance L and resistance R will typically have a time constant of L/R. Regardless of the inductance, if the resistance is large the time constant will be small and inductive effects will happen so quickly that they won’t really matter. If you want small resistance use copper wires, whose conductivity is a million times greater than saltwater. If you’re stuck with saline or other body fluids, the resistance will be high and the time constant will be short.

In summary, the reason why inductance is unimportant in biology is that there is no iron to increase the magnetic field, no copper to lower the resistance, no large number of turns of wire, the circuits are small, and the current changes too slowly. Inductive effects are tiny in biology, which is why we rarely discuss them in Intermediate Physics for Medicine and Biology.

Joseph Henry: Champion of American Science

https://www.youtube.com/watch?v=1t0nTCBG7jY&t=758s


 Inductors explained

https://www.youtube.com/watch?v=KSylo01n5FY

Friday, July 19, 2024

Happy Birthday, Robert Plonsey!

Wednesday was the 100th anniversary of Robert Plonsey’s birth. He is one of the most highly cited authors in Intermediate Physics for Medicine and Biology.

Plonsey was born on July 17, 1924 in New York City. He served in the navy during the second world war and then obtained his PhD in electrical engineering from Berkeley. In 1957 he joined Case Institute of Technology (now part of Case Western Reserve University) as an Assistant Professor. In 1983 he moved from Case to Duke University, joining their biomedical engineering department.

Plonsey and Barr, Biophys. J.,
45:557–571, 1984.
To honor Plonsey’s birthday, I want to look at one of my favorite papers: “Current Flow Patterns in Two-Dimensional Anisotropic Bisyncytia with Normal and Extreme Conductivities.” He and his Duke collaborator Roger Barr published it forty years ago, in the March, 1984 issue of the Biophysical Journal (Volume 45, Pages 557–571). The abstract is given below.
Cardiac tissue has been shown to function as an electrical syncytium in both intracellular and extracellular (interstitial) domains. Available experimental evidence and qualitative intuition about the complex anatomical structure support the viewpoint that different (average) conductivities are characteristic of the direction along the fiber axis, as compared with the cross-fiber direction, in intracellular as well as extracellular space. This report analyzes two-dimensional anisotropic cardiac tissue and achieves integral equations for finding intracellular and extracellular potentials, longitudinal currents, and membrane currents directly from a given description of the transmembrane voltage. These mathematical results are used as a basis for a numerical model of realistic (though idealized) two-dimensional cardiac tissue. A computer stimulation based on the numerical model was executed for conductivity patterns including nominally normal ventricular muscle conductivities and a pattern having the intra- or extracellular conductivity ratio along x, the reciprocal of that along y. The computed results are based on assuming a simple spatial distribution for [the transmembrane potential], usually a circular isochrone, to isolate the effects on currents and potentials [on] variations in conductivities without confounding propagation differences. The results are in contrast to the many reports that explicitly or implicitly assume isotropic conductivity or equal conductivity ratios along x and y. Specifically, with reciprocal conductivities, most current flows in large loops encompassing several millimeters, but only in the resting (polarized) region of the tissue; further, a given current flow path often includes four or more rather than two transmembrane excursions. The nominally normal results showed local currents predominantly with only two transmembrane passages; however, a substantial part of the current flow patterns in two-dimensional anisotropic bisyncytia may have qualitative as well as quantitative properties entirely different from those of one-dimensional strands.
This article was one of the first to analyze cardiac tissue using the bidomain model. In 1984 (the year before I published my first scientific paper as a young graduate student at Vanderbilt University) the bidomain model was only a few years old. Plonsey and Barr cited Otto Schmitt, Walter Miller, David Geselowitz, and Les Tung as the originators of the bidomain concept. One of Plonsey and Barr’s key insights was the role of anisotropy, and in particular the role of differences of anisotropy in the intracellular and extracellular spaces (sometimes referred to as “unequal anisotropy ratios”), in determining the tissue behavior. In their calculation, they assumed a known transmembrane potential wavefront and calculated the potentials and currents in the intracellular and extracellular spaces.

Plonsey and Barr found that for isotropic tissue, and for tissue with equal anisotropy ratios, the intracellular and extracellular currents were equal and opposite, so the net current (intracellular plus extracellular) was zero. However, for nominal conductivities that have unequal anisotropy ratios they found the net current did not cancel, but instead formed loops that extended well outside the region of the wave front.

Looking back at this paper after several decades, the computational technique seems cumbersome and the plots of the current distributions look primitive. However, Plonsey and Barr were among the first to examine these issues, and when you’re first you can be forgiven if the analysis isn’t as polished as in subsequent reports.

When Plonsey and Barr’s paper was published, my graduate advisor John Wikswo realized the the large current loops they predicted would produce a measurable magnetic field. That story I’ve told before in this blog. Plonsey’s article led directly to Nestor Sepulveda and Wikswo’s paper on the biomagnetic field signature of the bidomain model, indirectly to my adoption of the bidomain model for studying a strand of cardiac tissue, and ultimately to the Sepulveda/Roth/Wikswo analysis of unipolar electrical stimulation of cardiac tissue

Happy birthday, Robert Plonsey. We miss ya!

Friday, July 12, 2024

Taylor Series

The Taylor series is particularly useful for analyzing how functions behave in limiting cases. This is essential when translating a mathematical expression into physical intuition, and I would argue that the ability to do such translations is one of the most important skills an aspiring physicist needs. Below I give a dozen examples from Intermediate Physics for Medicine and Biology, selected to give you practice with Taylor series. In each case, expand the function in the dimensionless variable that I specify. For every example—and this is crucial—interpret the result physically. Think of this blog post as providing a giant homework problem about Taylor series.

Find the Taylor series of:
  1. Eq. 2.26 as a function of bt (this is Problem 26 in Chapter 2). The function is the solution for decay plus input at a constant rate. You will need to look up the Taylor series for an exponential, either in Appendix D or in your favorite math handbook. I suspect you’ll find this example easy.
  2. Eq. 4.69 as a function of ξ (this is Problem 47 in Chapter 4). Again, the Taylor series for an exponential is required, but this function—which arises when analyzing drift and diffusion—is more difficult than the last one. You’ll need to use the first four terms of the Taylor expansion.
  3. The argument of the inverse sine function in the equation for C(r,z) in Problem 34 of Chapter 4, as a function of z/a (assume r is less than a). This expression arises when calculating the concentration during diffusion from a circular disk. Use your Taylor expansion to show that the concentration is uniform on the disk surface (z = 0). This calculation may be difficult, as it involves two different Taylor series. 
  4. Eq. 5.26 as a function of ax. Like the first problem, this one is not difficult and merely requires expanding the exponential. However, there are two equations to analyze, arising from the study of countercurrent transport
  5. Eq. 6.10 as a function of z/c (assume c is less than b). You will need to look up or calculate the Taylor series for the inverse tangent function. This expression indicates the electric field near a rectangular sheet of charge. For z = 0 the electric field is constant, just as it is for an infinite sheet.
  6. Eq. 6.75b as a function of b/a. This equation gives the length constant for a myelinated nerve axon with outer radius b and inner radius a. You will need the Taylor series for ln(1+x). The first term of your expansion should be the same as Eq. 6.75a: the length constant for an unmyelinated nerve with radius a and membrane thickness b.
  7. The third displayed equation of Problem 46 in Chapter 7 as a function of t/tC. This expression is for the strength-duration curve when exciting a neuron. Interestingly, the short-duration behavior is not the same as for the Lapicque strength-duration curve, which is the first displayed equation of Problem 46.
  8. Eq. 9.5 as a function of [M']/[K]. Sometimes it is tricky to even see how to express the function in terms of the required dimensionless variable. In this case, divide both sides of Eq. 9.5, to get [K']/[K] in terms of [M']/[K]. This problem arises from analysis of Donnan equilibrium, when a membrane is permeable to potassium and chloride ions but not to large charged molecules represented by M’.
  9. The expression inside the brackets in Eq. 12.42 as a function of ξ. The first thing to do is to find the Taylor expansion of sinc(ξ), which is equal to sin(ξ)/ξ. This function arises when solving tomography problems using filtered back projection.
  10. Eq. 13.39 as a function of a/z. The problem is a little confusing, because you want the limit of large (not small) z, so that a/z goes to zero. The goal is to show that the intensity falls off as 1/z2 for an ultrasonic wave in the Fraunhoffer zone.
  11. Eq. 14.33 as a function of λkBT/hc. This problem really is to determine how the blackbody radiation function behaves as a function of wavelength λ, for short wavelength (high energy) photons. You are showing that Planck's blackbody function does not suffer from the ultraviolet catastrophe.
  12. Eq. 15.18 as a function of x. (This is Problem 15 in Chapter 15). This function describes how the Compton cross section depends on photon energy. Good luck! (You’ll need it).

Brook Taylor
Who was Taylor? Brook Taylor (1685-1731) was an English mathematician and a fellow of the Royal Society. He was a champion of Newton’s version of the calculus over Leibniz’s, and he disputed with Johann Bernoulli. He published a book on mathematics in 1715 that contained his series.

Friday, July 5, 2024

Depth of Field and the F-Stop

In Chapter 14 of Intermediate Physics for Medicine and Biology, Russ Hobbie and I briefly discuss depth of field: the distance between the nearest and the furthest objects that are in focus in an image captured with a lens. However, we don’t go into much detail. Today, I want to explain depth of field in more—ahem—depth, and explore its relationship to other concepts like the f-stop. Rather than examine these ideas quantitatively using lots of math, I’ll explain them qualitatively using pictures.

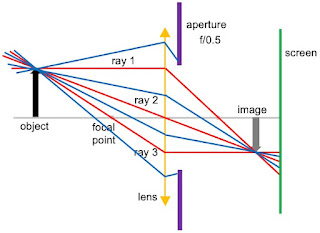
Consider a simple optical system consisting of a converging lens, an aperture, and a screen to detect the image. This configuration looks like what you might find in a camera with the screen being film (oh, how 20th century) or an array of light detectors. Yet, it also could be the eye, with the aperture representing the pupil and the screen being the retina. We’ll consider a generic object positioned to the left of the focal point of the lens. 


To determine where the image is formed, we can draw three light rays. The first leaves the object horizontally and is refracted by the lens so it passes through the focal point on the right. The second passes through the center of the lens and is not refracted. The third passes through the focal point on the left and after it is refracted by the lens it travels horizontally. Where these three rays meet is where the image forms. Ideally, you would put your screen at this location and record a nice crisp image. 


Suppose you are really interested in another object (not shown) to the right of the one in the picture above. Its image would be to the right of the image shown, so that is where we place our screen. In that case, the image of our first object would not be in focus. Instead, it would form a blur where the three rays hit the screen. The questions for today are: how bad is this blurring and what can we do to minimize it?

So far, we haven’t talked about the aperture. All three of our rays drawn in red pass through the aperture. Yet, these aren’t the only three rays coming from the object. There are many more, shown in blue below. Ones that hit the lens near its top or bottom never reach the screen because they are blocked by the aperture. The size of the blurry spot on the screen is specified by a dimensionless number called the f-stop: the ratio of the aperture diameter to the focal length of the lens. It is usually written f/#, where # is the numerical value of the f-stop. In the picture below, the aperture diameter is twice the focal length, so the f-stop is f/0.5.

 
We can reduce the blurriness of the out-of-focus object by partially closing the aperture. In the illustration below, the aperture is narrower and now has a diameter equal to the focal length, so the f-stop is f/1. More rays are blocked from reaching the screen, and the size of the blur is decreased. In other words, our image looks closer to being in focus than it did before. The blurring of an out-of-focus image is reduced. 


It seems like we got something for nothing. Our image is crisper and better just by narrowing the aperture. Why not narrow it further? We can, and the figure below has an f-stop of f/2. The blurring is reduced even more. But we have paid a price. The narrower the aperture, the less light reaches the screen. Your image is dimmer. And this is a bigger effect than you might think from my illustration, because the amount of light goes as the square of the aperture diameter (think in three dimensions). To make up for the lack of light, you could detect the light for a longer time. In a camera, the shutter speed indicates how long the aperture is open and light reaches the screen. Usually as the f-stop is increased (the aperture is narrowed), the shutter speed is changed so the light hits the screen for a longer time. If you are taking a picture of a stationary object, this is not a problem. If the object is moving, you will get a blurry image not because the image is out of focus on the screen, but because the image is moving across the screen. So, there are tradeoffs. If you want a large depth of focus and you don’t mind using a slow shutter speed, use a narrow aperture (a large f-stop). If you want to get a picture of a fast moving object using a fast shutter speed, your image may be too dim unless you use a wide aperture (small f-stop), and you will have to sacrifice depth of field. 

With your eye, there is no shutter speed. The eye is open all the time, and your pupil adjusts its radius to let in the proper amount of light. If you are looking at objects in dim light, your pupil will open up (have a larger radius) and you will have problems with depth-of-focus. In bright light the pupil will narrow down and images will appear crisper. If you are like me and you want to read some fine print but you forgot where you put your reading glasses, the next best thing is to try reading under a bright light.

Most photojournalists use fairly large f-stops, like f/8 or f/16, and a shutter speed of perhaps 5 ms. The human eye has an f-stop between f/2 (dim light) and f/8 (bright light). So, my illustrations above aren’t really typical; the aperture is generally much narrower.

Friday, June 28, 2024

Could Ocean Acidification Deafen Dolphins?

In Chapter 13 of Intermediate Physics for Medicine and Biology, Russ Hobbie and I discuss the attenuation of sound.
Water transmits sound better than air, but its attenuation is an even stronger function of frequency. It also depends on the salt content. At 1000 Hz, sound attenuates in fresh water by about 4 × 10⁻⁴ dB km−1. The attenuation in sea water is about a factor of ten times higher (Lindsay and Beyer 1989). The low attenuation of sound in water (especially at low frequencies) allows aquatic animals to communicate over large distances (Denny 1993).
“Ocean Acidification and the Increasing Transparency of the Ocean to Low-Frequency Sound,” Oceanography, 22: 86–93, 2009 superimposed on the cover of Intermediate Physics for Medicine and Biology.
“Ocean Acidification and the
Increasing Transparency of the Ocean
to Low-Frequency Sound,”
Oceanography, 22: 86–93, 2009.
To explore further into the attenuation of sound in seawater—and especially to examine that mysterious comment “it also depends on the salt content”— I will quote from an article by Peter Brewer and Keith Hester, titled “Ocean Acidification and the Increasing Transparency of the Ocean to Low-Frequency Sound” (Oceanography, Volume 22, Pages 86–93, 2009). The abstract is given below.
As the ocean becomes more acidic, low-frequency (~1–3 kHz and below) sound travels much farther due to changes in the amounts of pH-dependent species such as dissolved borate and carbonate ions, which absorb acoustic waves. The effect is quite large; a decline in pH of only 0.3 causes a 40% decrease in the intrinsic sound absorption properties of surface seawater. Because acoustic properties are measured on a logarithmic scale, and neglecting other losses, sound at frequencies important for marine mammals and for naval and industrial interests will travel some 70% farther with the ocean pH change expected from a doubling of CO2. This change will occur in surface ocean waters by mid century. The military and environmental consequences of these changes have yet to be fully evaluated. The physical basis for this effect is well known: if a sound wave encounters a charged molecule such as a borate ion that can be “squeezed” into a lower-volume state, a resonance can occur so that sound energy is lost, after which the molecule returns to its normal state. Ocean acousticians recognized this pH-sound linkage in the early 1970s, but the connection to global change and environmental science is in its infancy. Changes in pH in the deep sound channel will be large, and very-low-frequency sound originating there can travel far. In practice, it is the frequency range of ~ 300 Hz–10 kHz and the distance range of ~ 200–900 km that are of interest here.
To get additional insight, let us examine the structure of the negatively charged borate ion. It consists a central boron atom surrounded by four hydroxyl (OH) groups in a tetrahedral structure: B(OH)4. Also of interest is boric acid, which is uncharged and has the boron atom attached to three OH groups in a planar structure: B(OH)3. In water, the two are in equilibrium

B(OH)4 + H+ ⇔ B(OH)3 + H2O .

The equilibrium depends on pH and pressure. Brewer and Hester write
Boron exists in seawater in two forms—the B(OH)4 ion and the un-ionized form B(OH)3; their ratio is set by the pH of bulk seawater, and as seawater becomes more acidic, the fraction of the ionized B(OH)4 form decreases. Plainly, the B(OH)4 species is a bigger molecule than B(OH)3 and, because of its charge, also carries with it associated water molecules as a loose assemblage. This weakly associated complex can be temporarily compressed into a lower-volume form by the passage of a sound wave; there is just enough energy in a sound wave to do it. This compression takes work and thus robs the sound wave of some of its energy. Once the wave front has passed by, the B(OH)4 molecules return to their original volumes. Thus, in a more acidic ocean with fewer of the larger borate ions to absorb sound energy, sound waves will travel farther.
As sound waves travel farther, the oceans could become noisier. This behavior has even led one blogger to ask “could ocean acidification deafen dolphins?” 

Researchers at the Woods Hole Oceanographic Institution are skeptical of a dramatic change in sound wave propagation. In an article asking “Will More Acidic Oceans be Noisier?” science reporter Cherie Winner describes modeling studies by Woods Hole scientists such as Tim Duda. Winner explains
Results of the three models varied slightly in their details, but all told the same tale: The maximum increase in noise level due to more acidic seawater was just 2 decibels by the year 2100—a barely perceptible change compared to noise from natural events such as passing storms and big waves.
Duda said the main factor controlling how far sound travels in the seas will be the same in 100 years as it is today: geometry. Most sound waves will hit the ocean bottom and be absorbed by sediments long before they could reach whales thousands of kilometers away.
The three teams published their results in three papers in the September 2010 issue of the Journal of the Acoustical Society of America.
“We did these studies because of the misinformation going around,” said Duda. “Some papers implied, ‘Oh my gosh, the sound absorption will be cut in half, therefore the sound energy will double, and the ocean will be really noisy.’ Well, no, it doesn’t work that way.” 
So I guess we shouldn’t be too concerned about deafening those dolphins, but this entire subject is fascinating and highlights the role of physics for understanding medicine and biology.