Showing posts with label new homework problem. Show all posts

Friday, April 2, 2021

The Boltzmann Distribution Applied to a Harmonic Oscillator

In Chapter 3 of Intermediate Physics for Medicine and Biology, Russ Hobbie and I discuss the Boltzmann distribution. If you have a system with energy levels of energy En populated by particles in thermal equilibrium, the Boltzmann distribution gives the probability of finding a particle in the nth level.

A classic example of the Boltzmann distribution is for the energy levels of a harmonic oscillator. These levels are equally spaced starting from a ground state and increasing without bound. To see the power of the Boltzmann distribution, solve this new homework problem.
Section 3.7

Problem 29½. Suppose the energy levels, En, of a system are given by

En = n ε,     for  n = 0, 1, 2, 3, …

where ε is the energy difference between adjacent levels. Assume the probability of a particle occupying the nth energy level, Pn, obeys the Boltzmann distribution
where A is a constant, T is the absolute temperature, and k is the Boltzmann constant.

(a) Determine A in terms of ε, k, and T. (Hint: the sum of the probabilities over all levels is one.)
(b) Find the average energy E of the particles. (Hint: E = ∑PnEn.)
(c) Calculate the heat capacity C of a system of N such particles. (Hint: U = N E and C = dU/dT.)
(d) What is the limiting value of C for high temperatures (kT >> ε)? (Hint: use the Taylor series of the exponential.)
(e) What is the limiting value of C for low temperatures (kT << ε)?
(f) Sketch a plot of C versus T.
You may need these infinite series

1 + x + x2 + x3 + ⋯ = 1/(1x) 
x + 2x2 + 3x3 + ⋯ = x/(1x)2 

This is a somewhat advanced problem in statistical mechanics, so I gave several hints to guide the reader. The calculation contains much interesting physics. For instance, the answer to part (e) is known as the third law of thermodynamics. Albert Einstein was the first to calculate the heat capacity of a collection of harmonic oscillators (a good model for a crystalline solid). Theres more physics than biology in this problem, because most of the interesting behavior occurs at cold temperatures but biology operates at hot temperatures.

If you’re having difficulty solving this problem, here
s one more hint:

enx = (ex)n

Enjoy!

Friday, February 26, 2021

Bridging Physics and Biology Teaching Through Modeling

In this blog, I often stress the value of toy models. I’m not the only one who feels this way. Anne-Marie Hoskinson and her colleagues suggest that modeling is an important tool for teaching at the interface of physics and biology (“Bridging Physics and Biology Teaching Through Modeling,” American Journal of Physics, Volume 82, Pages 434–441, 2014). They write
While biology and physics might appear quite distinct to students, as scientific disciplines they both rely on observations and measurements to explain or to make predictions about the natural world. As a shared scientific practice, modeling is fundamental to both biology and physics. Models in these two disciplines serve to explain phenomena of the natural world; they make predictions that drive hypothesis generation and data collection, or they explain the function of an entity. While each discipline may prioritize different types of representations (e.g., diagrams vs mathematical equations) for building and depicting their underlying models, these differences reflect merely alternative uses of a common modeling process. Building on this foundational link between the disciplines, we propose that teaching science courses with an overarching emphasis on scientific practices, particularly modeling, will help students achieve an integrated and coherent understanding that will allow them to drive discovery in the interdisciplinary sciences.
One of their examples is the cardiac cycle, which they compare and contrast with the thermodynamic Carnot cycle. The cardiac cycle is best described graphically, using a pressure-volume diagram. Russ Hobbie and I present a PV plot of the left ventricle in Figure 1.34 of Intermediate Physics for Medicine and Biology. Below, I modify this plot, trying to capture its essence while simplifying it for easier analysis. As is my wont, I present this toy model as a new homework problem.
Sec. 1.19

Problem 38 ½. Consider a toy model for the behavior of the heart’s left ventricle, as expressed in the pressure-volume diagram

(a) Which sections of the cycle (AB, BC, CD, DA) correspond to relaxation, contraction, ejection, and filling?

(b) Which points during the cycle (A, B, C, D) correspond to the aortic value opening, the aortic value closing, the mitral value opening, and the mitral valve closing?

(c) Plot the pressure versus time and the volume versus time (use a common horizontal time axis, but individual vertical pressure and volume axes).

(d) What is the systolic pressure (in mm Hg)?

(e) Calculate the stroke volume (in ml). 

(f) If the heart rate is 70 beats per minute, calculate the cardiac output (in m3 s–1).

(g) Calculate the work done per beat (in joules).

(h) If the heart rate is 70 beats per minute, calculate the average power output (in watts).

(i) Describe in words the four phases of the cardiac cycle.

(j) What are some limitations of this toy model?

The last two parts of the problem are crucial. Many students can analyze equations or plots, but have difficulty relating them to physical events and processes. Translation between words, pictures, and equations is an essential skill. 

All toy models are simplifications; one of their primary uses is to point the way toward more realistic—albeit more complex—descriptions. Many scientific papers contain a paragraph in the discussion section describing the approximations and assumptions underlying the research.

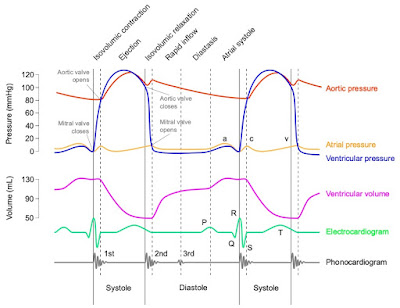
Below is a Wiggers diagram from Wikipedia, which illustrates just how complex cardiac physiology can be. Yet, our toy model captures many general features of the diagram.


A Wiggers diagram summarizing cardiac physiology.
Source: adh30 revised work by DanielChangMD who revised original work of DestinyQx;
Redrawn as SVG by xavax, CC BY-SA 4.0, via Wikimedia Commons

I’ll give Hoskinson and her coworkers the last word.

“We have provided a complementary view to transforming undergraduate science courses by illustrating how physics and biology are united in their underlying use of scientific models and by describing how this practice can be leveraged to bridge the teaching of physics and biology.”

The Wiggers diagram explained in three minutes!
https://www.youtube.com/watch?v=0sogXvxxV0E

Friday, February 5, 2021

The Spectrum of Scattered X-Rays

Chapter 15 of Intermediate Physics for Medicine and Biology discusses Compton Scattering. In this process, an x-ray photon scatters off a free electron, creating a scattered photon and a recoiling electron. The wavelength shift between the incident and scattered photons, Δλ, is given by the Compton scattering formula (Eq. 15.11 in IPMB)

Δλ = h/mc (1 − cosθ) ,

where h is Planck’s constant, c is the speed of light, m is the mass of the electron, and θ is the scattering angle. The quantity h/mc is called the Compton wavelength of the electron.

I enjoy studying experiments that first measure fundamental quantities like the Compton wavelength. Such an experiment is described in Arthur Compton’s article
Compton, A. H. (1923) The Spectrum of Scattered X-Rays. Physical Review, Volume 22, Pages 409–413.
Compton’s x-ray source (emitting the Kα line from molybdenum) irradiated a scatterer (graphite). He performed his experiment for different scattering angles θ. For each angle, he first collimated the scattered beam (using small holes in lead sheets) and then reflected it from a crystal (calcite). The purpose of the crystal was to determine the wavelength of the scattered photon by x-ray diffraction. Russ Hobbie and I don’t analyze x-ray diffraction in IPMB. The wavelength λ of the diffracted photon is given by Bragg’s law

λ = 2 d sinϕ ,

where d is the spacing of atomic planes (for calcite, d = 3.036 Å) and ϕ is the angle between the x-ray beam and the crystal surface. For fixed θ, Compton would rotate the crystal, thereby scanning ϕ and analyzing the beam as a function of wavelength. The intensity of the beam would be recorded by a detector (an ionization chamber).

Let’s analyze Compton’s experiment in a new homework problem.
Section 15.4

Problem 7½. Use the data below to calculate the Compton wavelength of the electron (in nm). Estimate the uncertainty in your value. Compton’s experiment detected x-rays at both the incident wavelength (coherent scattering) and at a modified or shifted wavelength (Compton scattering).
A drawing of Compton's data he used to determine the Compton wavelength of the electron.

I like this exercise because it requires the reader to do many things: 

  • Decide which spectral line is coherent scattering and which is Compton scattering. 
  • Choose which angle θ to analyze. 
  • Estimate the angle ϕ of each spectral peak from the data. 
  • Approximate the uncertainty in the estimation of ϕ
  • Convert the values of ϕ from degrees/minutes to decimal degrees
  • Determine the wavelength for each angle using Bragg’s law. 
  • Calculate the wavelength shift. 
  • Relate the wavelength shift to the Compton wavelength. 
  • Compute the Compton wavelength. 
  • Propagate the uncertainty
  • Convert from Ångstroms to nanometers.
If you can do all that, you know what you’re doing.

Compton’s experiment played a key role in establishing the quantum theory of light and wave-particle duality. He was awarded the 1927 Nobel Prize in Physics for this research. Let’s give him the last word. Here are the final two sentences of his paper.
This satisfactory agreement between the experiments and the theory gives confidence in the quantum formula for the change in wave-length due to scattering. There is, indeed, no indication of any discrepancy whatever, for the range of wave-length investigated, when this formula is applied to the wave-length of the modified ray.

Friday, November 13, 2020

The SIR Model of Epidemics

In Chapter 10 of Intermediate Physics for Medicine and Biology, Russ Hobbie and I discuss models described by nonlinear differential equations. We provide several examples in the text and homework problems, but one topic we never address is epidemics.

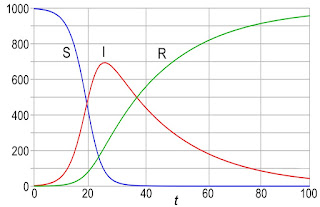
The archetype mathematical description of an epidemic is the SIR model. A population is divided into three categories, corresponding to three dynamic variables:

    S: the number of susceptible people

    I: the number of infected people

    R: the number of recovered people.

Three differential equations govern the number of people in each category.

    dS/dt = - (β/N) I S

    dI/dt = (β/N) I Sγ I

    dR/dt = γ I

where N is the total population, and β and γ are constants. Rather than analyze these equations myself, I’ll let you do it in a new homework problem.
Section 10.8

Problem 36 ½. The SIR model describes the dynamics of an epidemic. 
(a) Add the three differential equations and determine how the total number of people (S + I + R) changes with time. Does this model include people who die from the disease? 
(b) Write the equation governing the number of infected people as dI/dt = γI (r0 – 1). Find an expression for r0. Initially, when S = N, what does r0 reduce to? This value of r0 is known as the basic reproduction number. If r0 is less than what value will the number of infected people decay, preventing an epidemic?
(c) Suppose r0 is greater than one, so the number of infected people grows and the epidemic spreads. How low must the ratio S/N become for I to begin decreasing? Once this value of S/N is reached, the population is said to have herd immunity and the epidemic decays away.
Results from a numerical simulation of the SIR model.
Results from a numerical simulation of the SIR model, using S(0) = 997, I(0) = 3, R(0) = 0, β = 0.4, and γ = 0.04. By Klaus-Dieter Keller, CC0, https://commons.wikimedia.org/w/index.php?curid=77633956

The SIR model provides insight into the COVID-19 pandemic. It’s a simple model, and many researchers have modified it to be more realistic. Yet, there is value in a toy model like SIR. It lets you to gain intuition about a dynamical system without being overwhelmed by complexity. I always encourage students to first master a toy model, and only then add additional detail.

Monday, April 27, 2020

Donnan Equilibrium

Russ Hobbie and I analyze Donnan equilibrium in Chapter 9 of Intermediate Physics for Medicine and Biology.
Section 9.1 discusses Donnan equilibrium, in which the presence of an impermeant ion on one side of a membrane, along with other ions that can pass through, causes a potential difference to build up across the membrane. This potential difference exists even though the bulk solution on each side of the membrane is electrically neutral.
Today I present two new homework problems based on one of Donnan’s original papers.
Donnan, F. G. (1924) “The Theory of Membrane Equilibria.” Chemical Reviews, Volume 1, Pages 73-90.
Here’s the first problem.
Section 9.1

Problem 2 ½. Suppose you have two equal volumes of solution separated by a semipermeable membrane that can pass small ions like sodium and potassium but not large anions like A. Initially, on the left is 1 mole of Na+ and 1 mole of A, and on the right is 10 moles of K+ and 10 moles of A. What is the equilibrium amount of Na+, K+, and A on each side of the membrane?
Stop and solve the problem using the methods described in IPMB. Then come back and compare your solution with mine (and Donnan’s).

In equilibrium, x moles of sodium will cross the membrane from left to right. To preserve electroneutrality, x moles of potassium will cross from right to left. So on the left you have 1 – x moles of Na+, x moles of K+, and 1 mole of A. On the right you have x moles of Na+, 10 – x moles of K+, and 10 moles of A.

Both sodium and potassium are distributed by the same Boltzmann factor, implying that

           [Na+]left/[Na+]right = [K+]left/[K+]right = exp(−eV/kT)            (Eq. 9.4)

where e is the elementary charge, V is the voltage across the membrane, k is Boltzmann’s constant, and T is the absolute temperature. Therefore

           (1 – x)/x = x/(10 – x)

or x = 10/11 = 0.91. The equilibrium amounts (in moles) are

                          left       right
           Na+        0.09      0.91
           K+          0.91      9.09
           A          1.00    10.00

The voltage across the membrane is

           V = kT/e ln([Na+]right/[Na+]left) = (26.7 mV) ln(10.1) = 62 mV .

Donnan writes
In other words, 9.1 per cent of the potassium ions originally present [on the right] diffuse to [the left], while 90.9 per cent of the sodium ions originally present [on the left] diffuse to [the right]. Thus the fall of a relatively small percentage of the potassium ions down a concentration gradient is sufficient in this case to pull a very high percentage of the sodium ions up a concentration gradient. The equilibrium state represents the simplest possible case of two electrically interlocked and balanced diffusion-gradients.
Like this problem? Here’s another. Repeat the last problem, but instead of initially having 10 moles of K+ on the right, assume you have 10 moles of Ca++. Calcium is divalent; how will that change the problem?
Problem 3 ½. Suppose you have two solutions of equal volume separated by a semi-impermeable membrane that can pass small ions like sodium and calcium but not large anions like A and B.  Initially, on the left is 1 mole of Na+ and 1 mole of A, and on the right is 10 moles of Ca++ and 10 moles of B. What is the equilibrium amount of Na+, Ca++, A and B on each side of the membrane?
Again, stop, solve the problem, and then come back to compare solutions.

Suppose 2x moles of Na+ cross the membrane from left to right. To preserve electroneutrality, x moles of Ca++ move from right to left. Both cations are distributed by a Boltzmann factor (Eq. 9.4)

           [Na+]left/[Na+]right = exp(−eV/kT)

           [Ca++]left/[Ca++]right  = exp(−2eV/kT) .

However,

          exp(−2eV/kT) = [ exp(−eV/kT) ]2

so

      { [Na+]left/[Na+]right }2 = [Ca++]left/[Ca++]right

or
        [ (1 –2 x)/(2x) ]2 = x/(10 – x)

This is a cubic equation that I can’t solve analytically. Some trial-and-error numerical work suggests x = 0.414. The equilibrium amounts are therefore

                          left       right
           Na+        0.172    0.828
           Ca++      0.414    9.586
           A          1           0
           B        0          10 

The voltage across the membrane is

           V = kT/e ln([Na+]right/[Na+]left) = (26.7 mV) ln(4.814) = 42 mV .

I think this is correct; Donnan didn’t give the answer in this case, so I’m flying solo.
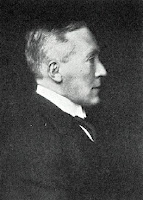
Frederick Donnan. From an article in the Journal of Chemical Education, Volume 4(7), page 819.
Frederick Donnan.
From an article in the Journal of Chemical Education,
Volume 4(7), page 819.
Who was Donnan? Frederick Donnan (1870 – 1956) was an Irish physical chemist. He obtained his PhD at the University of Leipzig under Wilhelm Ostwald, and then worked for Henry van’t Hoff. Most of his career was spent at the University College London. He was elected a fellow of the Royal Society and won the Davy Medal in 1928 “for his contributions to physical chemistry and particularly for his theory of membrane equilibrium.”

Wednesday, April 22, 2020

The Rayleigh-Einstein-Jeans law

In Chapter 14 of Intermediate Physics for Medicine and Biology, Russ Hobbie and I discuss blackbody radiation. Max Planck’s blackbody radiation formula is given in Eq. 14.33
where λ is the wavelength and T is the absolute temperature. This equation, derived in December 1900, is the first formula that contained Planck’s constant, h.

Often you can recover a classical (non-quantum) result by taking the limit as Planck’s constant goes to zero. Here’s a new homework problem to find the classical limit of the blackbody radiation formula.
Section 14.8

Problem 26 ½. Take the limit of Planck’s blackbody radiation formula, Eq. 14.33, when Planck’s constant goes to zero. Your result should should be the classical Rayleigh-Jeans formula. Discuss how it behaves as λ goes to zero. Small wavelengths correspond to the ultraviolet and x-ray part of the electromagnetic spectrum. Why do you think this behavior is known as the “ultraviolet catastrophe”?
Subtle is the Lord, by Abraham Pais, superimposed on Intermediate Physics for Medicine and Biology.
Subtle is the Lord,
by Abraham Pais.
I always thought that the Rayleigh-Jeans formula was a Victorian result that Planck knew about when he derived Eq. 14.33. However, when thumbing through Subtle is the Lord: The Science and the Life of Albert Einstein, by Abraham Pais, I learned that the Rayleigh-Jeans formula is not much older than Planck’s formula. Lord Rayleigh derived a preliminary version of it in June 1900, just months before Planck derived Eq. 14.33. He published a more complete version in 1905, except he was off by a factor of eight. James Jeans caught Rayleigh’s mistake, corrected it, and thereby got his name attached to the Rayleigh-Jeans formula. I am amazed that Planck’s blackbody formula predates the definitive version of the Rayleigh-Jeans formula.

Einstein rederived Rayleigh’s formula from basic thermodynamics principles in, you guessed it, his annus mirabilis, 1905. Pais concludes “it follows from this chronology (not that it matters much) that the Rayleigh-Jeans law ought properly to be called the Rayleigh-Einstein-Jeans law.”

Friday, April 3, 2020

Diffusion From a Micropipette

In Chapter 4 of Intermediate Physics for Medicine and Biology, Russ Hobbie and I solve the diffusion equation. We consider the classic one-dimensional example of particles released at a point (x = 0) and at one instant (t = 0). The particles diffuse, and the concentration C(x,t) has a Gaussian distribution

An equation for the concentration as a function of position and time during diffusion.

where D is the diffusion constant and N is the number of particles per unit area (assuming diffusion along a tube of fixed cross-sectional area).

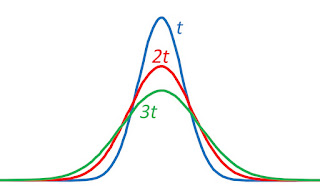
Often this concentration distribution is drawn as a function of x at a fixed time t (a snapshot). Russ and I include such an illustration in IPMB’s Figure 4.13. Below is a modified version of that figure, showing the Gaussian distribution at three times.
The concentration C(x,t) as a function of x at three times t, 2t, and 3t.
Alternatively, we could plot the concentration as a function of t, for a particular location x. Such a plot illustrates how a wave of particles diffuses outward, so at any point x the concentration starts at zero, rises quickly to a peak, and then slowly decays.

The concentration C(x,t) as a function of t at three locations x, 2x, and 3x.
We can calculate the time when the concentration reaches its peak, tpeak, by setting the time derivative of C(x,t) equal to zero and solving for t. The result is tpeak = x2/2D. To find the maximum value of the concentration, Cmax, at any location we plug tpeak into the expression for C(x,t) and find Cmax = 0.242N/x.

Random Walks in Biology, by Howard Berg, superimposed on Intermediate Physics for Medicine and Biologyl.
Random Walks in Biology,
by Howard Berg.
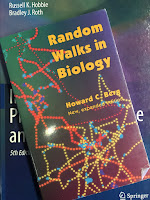
I was motivated to draw the concentration as a function of time by the discussion of diffusion in Howard Berg’s book Random Walks in Biology. He also analyzes the three-dimensional version of this problem. 
Diffusion from a micropipette: A micropipette filled with an aqueous solution of a green fluorescent dye is inserted into a large body of water. At time t = 0, particles of the dye are injected into the water… The total number of particles injected is N… [The diffusion equation] has the solution
An equation for the concentration as a function of position and time during diffusion.
This is a three-dimensional Gaussian distribution… Looking through a microscope, one sees the sudden appearance of a green spot that spreads rapidly outward and fades away. The concentration remains highest at the tip of the pipette, but it decreases there as the three-halves power of time.
I’ll let the reader analyze this case by writing a new homework problem. Enjoy!
Section 4.8

Problem 16 ½. When N particles released at time t = 0 and location r = 0 diffuse, the concentration C(r,t) is governed by
An equation for the concentration as a function of position and time during diffusion.
(a) Show that this expression for C(r,t) obeys the diffusion equation written in spherical coordinates
The diffusion equation in spherical coordinates.
(b) Integrate C(r,t) over all space and show that the number of particles is always N.

(c) Calculate the variance (the mean value of r2) and show that σ2 = 6Dt, as found in Problem 16. You may need an integral from Appendix K.
(d) Calculate the time tpeak when the concentration at a distance r is maximum.

(e) Calculate the maximum concentration, Cmax, at distance r.
(f) Sketch a plot of C(r,t) as a function of r for three times, and then plot C(r,t) as a function of t for three locations.

Thursday, March 26, 2020

The Goldman-Hodgkin-Katz Equation Including Calcium

In Section 9.6 of Intermediate Physics for Medicine and Biology, Russ Hobbie and I derive the Goldman-Hodgkin-Katz equation. It accounts for both diffusion and electrical forces acting on ions in the membrane (presumably passing through ion channels spanning the lipid bilayer). If only one ion were present, its concentration on each side of the membrane would determine the equilibrium, or reversal, potential. For instance more potassium is inside a cell than outside, so diffusion pushes the positively charged potassium ions out. As the outside becomes positive, the resulting electric field in the membrane pushes potassium back in. The reversal potential, vrev, is the potential across the membrane when diffusion and electrical forces balance.

Mathematically, we can derive the reversal potential for any ion C by starting with an expression for its current density, JC


where z is the valence, e is the elementary charge, v is the potential, ωC is the permeability, NA is Avogadro's number, kB is the Boltzmann constant, T is the absolute temperature, and [C1] and [C2] are the concentrations outside and inside the membrane. (See IPMB for a derivation of this complicated equation.) To find the reversal potential, we set JC to zero and solve for v.

When more than one ion can cross the membrane, the situation is more complicated. Russ and I examined a membrane that can pass three ions: sodium, potassium, and chloride. The resulting equation for the reversal potential—also known as the Goldman-Hodgkin-Katz equation—is

We then write
When ions have different valences, the GHK equation becomes more complicated. Lewis (1979) has derived an analogous equation for transport of sodium, potassium, and calcium.
The citation is to
Lewis CA (1979) “Ion-concentration dependence of the reversal potential and the single channel conductance of ion channels at the frog neuromuscular junction.” Journal of Physiology, Volume 286, Pages 417–445.
Below is a new homework problem, based on Appendix A of Lewis’s paper, analyzing a more complicated GHK equation that includes calcium along with sodium and potassium.
Section 9.6

Problem 20 ½. Derive an expression for the Goldman-Hodgkin-Katz equation when you have three ions that can pass through the membrane: sodium, potassium, and calcium.

(a) Write down an expression like Eq. 9.53 for the current density for each ion: JNa, JK, and JCa. Hint: be careful to include the valence z properly.

(b) Assume the amount of charge in the cell does not change with time, so JNa + JK + JCa = 0. Try to solve the resulting equation for the reversal potential, vrev. You should find it difficult, because the expression for JCa has a different denominator than do JNa and JK.

(c) Define a new permeability for calcium,
Now derive an expression for vrev. Your result should look similar to Eq. 9.55, except for some factors of four, and in the numerator the new calcium permeability will be multiplied by a voltage-dependent factor.
What’s the lesson to be learned from this homework problem? First, the GHK expression including calcium has the potential on the left side of the equation, but also on the right side, inside a logarithm. No simple way exists to calculate vrev. My first thought is to use an iterative method, but I haven’t looked into this in detail. Second, notice how a small modification to the problem—changing chloride to calcium—made a major change in how difficult the problem is to solve. Adding the negative chloride ion to positive sodium and potassium resulted in a trivial change to the GHK equation (the inside chloride concentration appears in the numerator rather than the outside concentration). However, adding the divalent cation calcium totally messes up the equation, making it difficult to solve except with numerical methods.

I advocate for simple models. They provide tremendous insight. However, the moral of this story is if you push a toy model too hard, it can become complicated; it’s no longer a toy.

Friday, November 1, 2019

Perrin, Einstein, and Avogadro's Number

Brownian Movement and Molecular Reality,  by Jean Perrin (1910),  translated by Frederick Soddy, superimposed on Intermediate Physics for Medicine and Biology.
Brownian Movement and Molecular Reality,
by Jean Perrin (1910),
translated by Frederick Soddy.
Chapter 4 of Intermediate Physics for Medicine and Biology includes a homework exercise (Problem 12) about Jean Perrin’s experiment to determine Avogadro’s number. Perrin measured the equilibrium distribution of small particles suspended in water as a function of height, fit his data to a Boltzmann factor to determine the Boltzmann constant, and then calculated Avogadro’s number via the gas constant. I like that homework problem because it combines a mini history lesson with a physics exercise, and the numbers aren’t made up; they came from Perrin’s book Brownian Movement and Molecular Reality.

Perrin didn’t use just one method to determine Avogadro’s number; he used several. Below I present a new homework problem describing another technique of Perrin’s. Again I draw data from his book.
Section 4.6

Problem 12 ½. Jean Perrin used a relationship between diffusion and viscosity to determine Avogadro’s number. He recorded the variance of the displacement, σ2, as a function of time, t, for small particles suspended in water. The particles had a radius, a, of 0.212 μm, and the viscosity of water, η, was 0.0012 N s/m2 at a temperature, T, of 17 °C.

(a) Use the data below and Eq. 4.77 to estimate the diffusion constant, D, of the particles.
         t  (s)    σ2  (μm2)
          30       45
          60       86.5
          90     140
        120     195
Either use the least squares method of Sec. 11.1 to fit the data, or estimate an average value of D by trial and error.
(b) Use the Einstein relationship, Eq. 4.23, to determine Boltzmann’s constant, kB, from the diffusion constant found in part (a).

(c) Use your result from part (b), along with the gas constant, R, and Eq. 3.31, to calculate Avogadro’s number, NA. Your result may not be the same as the currently accepted value of NA, but it should be close.
For those of you who don’t have your copy of IPMB at your side, Eq. 4.77 is
A mathematical expression relating the variance in space to time and the diffusion constant.
Eq. 4.23 is
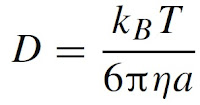
A mathematical expression relating the diffusion constant to the temperature, viscosity, and radius.
and Eq. 3.31 is

Avogadro's number times Boltzmann's constant equals the gas constant.

‘Subtle is the Lord...’: The Science and Life of Albert Einstein, by Abraham Pais, superimposed on Intermediate Physics for Medicine and Biology.
‘Subtle is the Lord...’:
The Science and Life
of Albert Einstein,
by Abraham Pais.
Although Perrin was the first to perform this experiment, Albert Einstein initially proposed the idea during his miraculous year, 1905. The story behind this method can be found in Abraham Pais’s magnificent biography ‘Subtle is the Lord…’. Pais writes
One never ceases to experience surprise at this result, which seems, as it were, to come out of nowhere: prepare a set of small spheres which are nevertheless huge compared with simple molecules, use a stopwatch and a microscope, and find Avogadro’s number.
During the first decade of the twentieth century, the research by Perrin and Einstein confirmed the existence of atoms.

I’ll give Perrin the last word by quoting from the conclusion of Brownian Movement and Molecular Reality.
I think it is impossible that a mind, free from all preconception, can reflect upon the extreme diversity of phenomena which thus converge to the same result, without experiencing a very strong impression, and I think that it will henceforth be difficult to defend by rational arguments a hostile attitude to molecular hypotheses.

Friday, February 15, 2019

The Electric Field Induced During Magnetic Stimulation

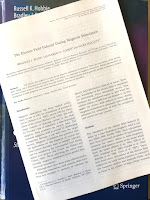
Chapter 8 of Intermediate Physics for Medicine and Biology discusses electromagnetic induction and magnetic stimulation of nerves. It doesn't, however, explain how to calculate the electric field. You can learn how to do this from my article “The Electric Field Induced During Magnetic Stimulation” (Electroencephalography and Clinical Neurophysiology, Supplement 43, Pages 268-278, 1991). It begins:
A photograph of the first page of The Electric Field Induced During Magnetic Stimulation by Roth, Cohen ad Hallett (EEG Suppl 43:268-278, 1991), superimposed on the cover of Intermediate Physics for Medicine and Biology.
“The Electric Field Induced
During Magnetic Stimulation.”
Magnetic stimulation has been studied widely since its use in 1982 for stimulation of peripheral nerves (Polson et al. 1982), and in 1985 for stimulation of the cortex (Barker et al. 1985). The technique consists of inducing current in the body by Faraday’s law of induction: a time-dependent magnetic field produces an electric field. The transient magnetic field is created by discharging a capacitor through a coil held near the target neuron. Magnetic stimulation has potential clinical applications for the diagnosis of central nervous system disorders such as multiple sclerosis, and for monitoring the corticospinal tract during spinal cord surgery (for review, see Hallett and Cohen 1989). When activating the cortex transcranially, magnetic stimulation is less painful than electrical stimulation.
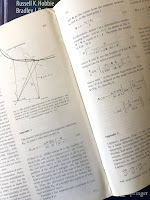
Appendix 1 in the paper The Electric Field Induced During Magnetic Stimulation by Roth, Cohen ad Hallett (Electroencephalography and Clinical Neurophysiology, Suppl 43: 268-278, 1991), superimposed on the cover of Intermediate Physics for Medicine and Biology.
Appendix 1.
Although there have been many clinical studies of magnetic stimulation, until recently there have been few attempts to measure or calculate the electric field distribution induced in tissue. However, knowledge of the electric field is important for determining where stimulation occurs, how localized the stimulated region is, and what the relative efficacy of different coil designs is. In this paper, the electric field induced in tissue during magnetic stimulation is calculated, and results are presented for stimulation of both the peripheral and central nervous systems.
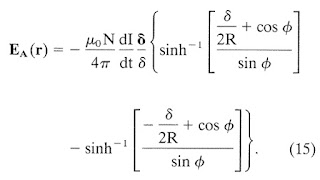
In Appendix 1 of this article, I derived an expression for the electric field E at position r, starting from
An equation for the electric field induced during magnetic stimulation.
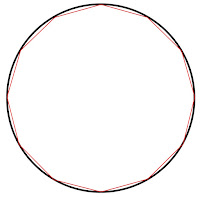
where N is the number of turns in the coil, μ0 is the permeability of free space (4π × 10-7 H/m), I is the coil current, r' is the position along the coil, and the integral of dl' is over the coil path. For all but the simplest of coil shapes this integral can't be evaluated analytically, so I used a trick: approximate the coil as a polygon. A twelve-sided polygon looks a lot like a circular coil. You can make the approximation even better by using more sides.
A circular coil approximated by a 12-sided polygon.
A circular coil (black) approximated by
a 12-sided polygon (red).
With this method I needed to calculate the electric field only from line segments. The calculation for one line segment is summarized in Figure 6 of the paper.
Figure 6 from The Electric Field Induced During Magnetic Stimulation, showing the polygon approximation to the coil geometry.
Figure 6 from “The Electric Field
Induced During Magnetic Stimulation.”
I will present the calculation as a new homework problem for IPMB. (Warning: t has two meanings in this problem: it denotes time and is also a dimensionless parameter specifying location along the line segment.)
Section 8.7

Problem 32 ½. Calculate the integral
The integral needed to calculate the electric field induced during magnetic stimulation.
for a line segment extending from x2 to x1. Define δ = x1 - x2 and R = r - ½(x1 + x2).
(a) Interpret δ and R physically.
(b) Define t as a dimensionless parameter ranging from -½ to ½. Show that r' equals rRtδ.
(c) Show that the integral becomes
An intermediate step in the calculation of the electric field induced during magnetic stimulation.
(d) Evaluate this integral. You may need a table of integrals.
(e) Express the integral in terms of δ, R, and φ (the angle between R and δ).

The resulting expression for the electric field is Equation 15 in the article
Equation (15) in The Electric Field During Magnetic Stimulation by Roth, Cohen ad Hallett (Electroencephalography and Clinical Neurophysiology, Suppl 43: 268-278, 1991).
Equation (15) in “The Electric Field Induced During Magnetic Stimulation.”
The photograph below shows the preliminary result in my research notebook from when I worked at the National Institutes of Health. I didn't save the reams of scrap paper needed to derive this result.

The November 10, 1988 entry in my research notebook, where I derive the equation for the electric field induced during magnetic stimulation.
The November 10, 1988 entry
in my research notebook.
To determine the ends of the line segments, I took an x-ray of a coil and digitized points on it. Below are coordinates for a figure-of-eight coil, often used during magnetic stimulation. The method was low-tech and imprecise, but it worked.

The November 17, 1988 entry in my research notebook, in which I digitized points along a figure-of-eight coil used for magnetic stimulation.
The November 17, 1988 entry
in my research notebook.
Ten comments:
  • My coauthors were Leo Cohen and Mark Hallett, two neurologists at NIH. I recommend their four-page paper “Magnetism: A New Method for Stimulation of Nerve and Brain.”
  • The calculation above gives the electric field in an unbounded, homogeneous tissue. The article also analyzes the effect of tissue boundaries on the electric field.
  • The integral is dimensionless. “For distances from the coil that are similar to the coil size, this integral is approximately equal to one, so a rule of thumb for determining the order of magnitude of E is 0.1 N dI/dt, where dI/dt has units of A/μsec and E is in V/m.”
  • The inverse hyperbolic sine can be expressed in terms of logarithms: sinh-1z = ln[z + √(z2 + 1)]. If you're uncomfortable with hyperbolic functions, perhaps logarithms are more to your taste. 
  • This supplement to Electroencephalography and Clinical Neurophysiology contained papers from the International Motor Evoked Potential Symposium, held in Chicago in August 1989. This excellent meeting guided my subsequent research into magnetic stimulation. The supplement was published as a book: Magnetic Motor Stimulation: Principles and Clinical Experience, edited by Walter Levy, Roger Cracco, Tony Barker, and John Rothwell
  • Leo Cohen was first author on a clinical paper published in the same supplement: Cohen, Bandinelli, Topka, Fuhr, Roth, and Hallett (1991) “Topographic Maps of Human Motor Cortex in Normal and Pathological Conditions: Mirror Movements, Amputations and Spinal Cord Injuries.”
  • To be successful in science you must be in the right place at the right time. I was lucky to arrive at NIH as a young physicist in 1988—soon after magnetic stimulation was invented—and to have two neurologists using the new technique on their patients and looking for a collaborator to calculate electric fields.
  • A week after deriving the expression for the electric field, I found a similar expression for the magnetic field. It was never published. Let me know if you need it.
  • If you look up my article, please forgive the incorrect units for μ0 given in the Appendix. They should be Henry/meter, not Farad/meter. In my defense, I had it correct in the body of the article. 
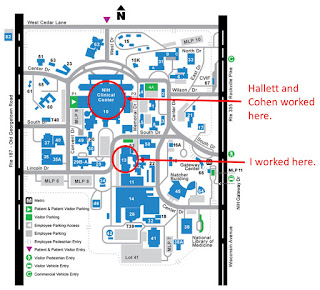
  • Correspondence about the article was to be sent to “Bradley J. Roth, Building 13, Room 3W13, National Institutes of Health, Bethesda, MD 20892.” This was my office when I worked at the NIH intramural program between 1988 and 1995. I loved working at NIH as part of the Biomedical Engineering and Instrumentation Program, which consisted of physicists, mathematicians and engineers who collaborated with the medical doctors and biologists. Cohen and Hallett had their laboratory in the NIH Clinical Center (Building 10), and were part of the National Institute of Neurological Disorders and Stroke. Hallett once told me he began his undergraduate education as a physics major, but switched to medicine after one of his professors tried to explain how magnetic fields are related to electric fields in special relativity.
A map of the National Institutes of Health campus in Bethesda, Maryland. I worked in Building 13. Hallett and Cohen worked in Building 10 (the NIH Clinical Center).
A map of the National Institutes of Health campus
in Bethesda, Maryland.

Friday, January 18, 2019

Five New Homework Problems About Diffusion

Diffusion is a central concept in biological physics, but it's seldom taught in physics classes. Russ Hobbie and I cover diffusion in Chapter 4 of Intermediate Physics for Medicine and Biology.

The one-dimensional diffusion equation,
The diffusion equation.
is one of the “big threepartial differential equations. Few analytical solutions to this equation exist. The best known is the decaying Gaussian (Eq. 4.25 in IPMB). Another corresponds to when the concentration is initially constant for negative values of x and is zero for positive values of x (Eq. 4.75). This solution is written in terms of error functions, which are integrals of the Gaussian (Eq. 4.74). I wonder: are there other simple examples illustrating diffusion? Yes!

In this post, my goal is to present several new homework problems that provide a short course in the mathematics of diffusion. Some extend the solutions already included in IPMB, and some illustrate additional solutions. After reading each new problem, stop and try to solve it!

Section 4.13
Problem 48.1. Consider one-dimensional diffusion, starting with an initial concentration of C(x,0)=Co for x less than 0 and C(x,0)=0 for x greater than 0. The solution is given by Eq. 4.75
A solution to the diffusion equation containing an error function.
where erf is the error function.
(a) Show that for all times the concentration at x=0 is C0/2.
(b) Derive an expression for the flux density, j = -DC/∂x at x = 0. Plot j as a function of time. Interpret what this equation is saying physically. Note: 
The derivative of the error function equals 2 over pi times the Gaussian function.

Problem 48.2. Consider one-dimensional diffusion starting with an initial concentration of C(x,0)=Co for |x| less than L and 0 for |x| greater than L.
(a) Plot C(x,0), analogous to Fig. 4.20.
(b) Show that the solution
A solution to the diffusion equation containing two error functions.
obeys both the diffusion equation and the initial condition.
(c) Sketch a plot of C(x,t) versus x for several times, analogous to Fig. 4.22.
(d) Derive an expression for how the concentration at the center changes with time, C(0,t). Plot it.

Problem 48.3. Consider one-dimensional diffusion in the region of x between -L and L. The concentration is zero at the ends, CL,t)=0.
(a) If the initial concentration is constant, C(x,0)=Co, this problem cannot be solved in closed form and requires Fourier series introduced in Chapter 11. However, often such a problem can be simplified using dimensionless variables. Define X = x/L, T = t/(L2/D) and Y = C/Co. Write the diffusion equation, initial condition, and boundary conditions in terms of these dimensionless variables.
(b) Using these dimensionless variables, consider a different initial concentration Y(X,0)=cos(Xπ/2). This problem has an analytical solution (see Problem 25). Show that Y(X,T)=cos(Xπ/2) e2T/4 obeys the diffusion equation as well as the boundary and initial conditions.

Problem 48.4. In spherical coordinates, the diffusion equation (when the concentration depends only on the radial coordinate r) is (Appendix L)

The diffusion equation in spherical coordinates.
Let C(r,t) = u(r,t)/r. Determine a partial differential equation governing u(r,t). Explain how you can find solutions in spherical coordinates from solutions of analogous one-dimensional problems in Cartesian coordinates.

Problem 48.5. Consider diffusion in one-dimension from x = 0 to ∞. At the origin the concentration oscillates with angular frequency ω, C(0,t) = Co sin(ωt).
(a) Determine the value of λ that ensures the expression
The solution to the diffusion equation when the concentration at the origin oscillates sinusoidally.
obeys the diffusion equation.
(b) Show that the solution in part (a) obeys the boundary condition at x = 0.
(c) Use a trigonometric identity to write the solution as the product of a decaying exponential and a traveling wave (see Section 13.2). Determine the wave speed.
(d) Plot C(x,t) as a function of x at times t = 0, π/2ω, π/ω, 3π/2ω, and 2π/ω.
(e) Describe in words how this solution behaves. How does it change as you increase the frequency?

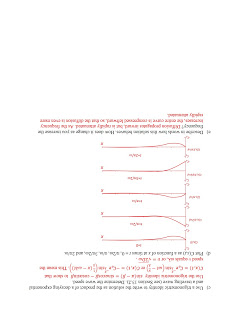
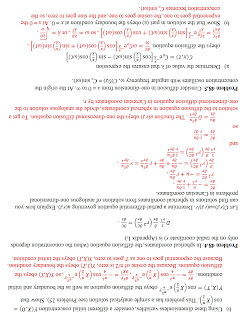
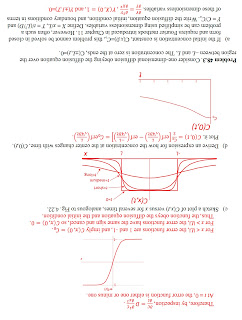
Of the five problems, my favorite is the last one; be sure to try it. But all the problems provide valuable insight. That’s why we include problems in IPMB, and why you should do them. I have included the solutions to these problems at the bottom of this post (upside down, making it more difficult to check my solutions without you trying to solve the problems first).

Random Walks in Biology, by Howard Berg, superimposed on the cover of Intermediate Physics for Medicine and Biology
Random Walks in Biology,
by Howard Berg.
Interested in learning more about diffusion? I suggest starting with Howard Berg’s book Random Walks in Biology. It is at a level similar to Intermediate Physics for Medicine and Biology.

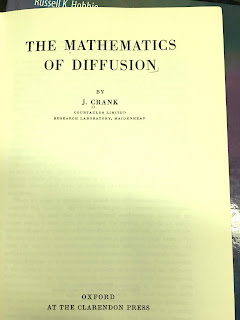
After you have mastered it, move on to the classic texts by Crank (The Mathematics of Diffusion) and Carslaw and Jaeger (Conduction of Heat in Solids). These books are technical and contain little or no biology. Mathephobes may not care for them. But if you’re trying to solve a tricky diffusion problem, they are the place to go.

Enjoy!


Title page of The Mathematics of Diffusion, by Crank, superimposed on the cover of Intermediate Physics for Medicine and Biology.
The Mathematics of Diffusion.
The title page of Conduction of Heat in Solids, by Carslaw and Jaeger, superimposed on the cover of Intermediate Physics for Medicine and Biology.
The Conduction of Heat in Solids.
Page 45 of The Mathematics of Diffusion, by Crank. It contains a lot of equations.
I told you these books are technical! (Page 45 of Crank)
Page 4 of the solution to the new diffusion problems for Intermediate Physics for Medicine and Biology.
Page 4
Page 3 of the solution to the new diffusion problems for Intermediate Physics for Medicine and Biology.
Page 3
Page 2 of the solution to the new diffusion problems for Intermediate Physics for Medicine and Biology.
Page 2
Page 1 of the solution to the new diffusion problems for Intermediate Physics for Medicine and Biology.
Page 1