Showing posts with label my own research. Show all posts

Friday, December 9, 2016

Capabilities of a Toroid-Amplifier System for Magnetic Measurement of Current in Biological Tissue

In Section 8.9 of Intermediate Physics for Medicine and Biology, Russ Hobbie and I discuss the detection of weak magnetic fields.
If the [magnetic] signal is strong enough, it can be detected with conventional coils and signal-averaging techniques that are described in Chap. 11. Barach et al. (1985) used a small detector through which a single axon was threaded. The detector consisted of a toroidal magnetic core wound with many turns of fine wire... Current passing through the hole in the toroid generated a magnetic field that was concentrated in the ferromagnetic material of the toroid. When the field changed, a measurable voltage was induced in the surrounding coil. This neuromagnetic current probe has been used to study many nerve and muscle fibers (Wijesinghe 2010).
I have discussed the neuromagnetic current probe before in this blog. One of the best places to learn more about it is a paper by Frans Gielen, John Wikswo, and me in the IEEE Transactions on Biomedical Engineering (Volume 33, Pages 910–921, 1986). The paper begins
In one-dimensional tissue preparations, bioelectric action currents can be measured by threading the tissue through a wire-wound, ferrite-core toroid that detects the associated biomagnetic field. This technique has several experimental advantages over standard methods used to measure bioelectric potentials. The magnetic measurement does not damage the cell membrane, unlike microelectrode recordings of the internal action potential. Recordings can be made without any electrical contact with the tissue, which eliminates problems associated with the electrochemistry at the electrode-tissue interface. While measurements of the external electric potential depend strongly on the distance between the tissue and the electrode, measurements of the action current are quite insensitive to the position of the tissue in the toroid. Measurements of the action current are also less sensitive to the electrical conductivity of the tissue around the current source than are recordings of the external potential.
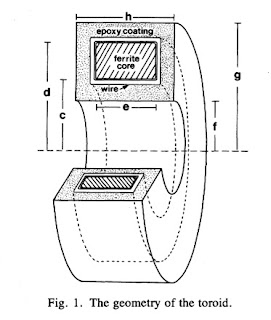
Figure 1 of this paper shows the toroid geometry
A illustration of a toroidal coil from Capabilities of a Toroid-Amplifier System for Magnetic Measurement of Current in Biological Tissue, by Gielen et al. (IEEE Trans Biomed Eng, 33:910-921, 1986)
When I was measuring biomagnetic fields back in graduate school, I wanted to relate the magnetic field in the toroid to the current passing through it. For simplicity, assume the current is in a wire passing through the toroid center. The magnetic field B a distance r from a wire carrying current i is (Eq. 8.7 in IPMB)
An equation giving the magnetic field produced by a current-carrying wire.
where μ is the magnetic permeability. The question is, what value should I use for r? Should I use the inner radius, the outer radius, the width, or some combination of these? The answer can be found by solving this new homework problem.
Section 8.2
Problem 11 1/2. Suppose a toroid having inner radius c, outer radius d, and width e is used to detect current i in a wire threading the toroids center. The voltage induced in the toroid is proportional to the magnetic flux through its cross section.
(a) Integrate the magnetic field produced by the current in the wire across the cross section of the ferrite core to obtain the magnetic flux.
(b) Calculate the average magnetic field in the toroid, which is equal to the flux divided by the toroid cross-sectional area.
(c) Define the “effective radius” of the toroid, reff, as the radius needed in Eq. 8.7 to relate the current in the wire to the average magnetic field. Derive an expression for reff in terms of the parameters of the toroid.
(d) If c = 1 mm, d = 2 mm, e = 1 mm, and μ=104μo, calculate reff.
The solution to this homework problem, the effective radius, appears on page 915 of our paper.

Finally, and just for fun, below I reproduce the short bios published with the paper, which appeared 30 years ago.
A brief bio of Frans Gielen, published in IEEE Trans Biomed Eng.

A brief bio of Brad Roth, published in IEEE Trans Biomed Eng.

A brief bio of John Wikswo, published in IEEE Trans Biomed Eng.

Friday, August 19, 2016

How to Explain Why Unequal Anisotropy Ratios is Important Using Pictures but No Mathematics

Ten years ago, at the IEEE Engineering in Medicine and Biology Society Annual Conference in New York City, I presented a paper titled “How to Explain Why Unequal Anisotropy Ratios is Important Using Pictures but No Mathematics.” Although it was only a four-page conference proceeding, it remains one of my favorite papers.
I. Introduction 

The bidomain model describes the electrical properties of cardiac tissue. The term “bidomain” arises because the model accounts for two (“bi”) spaces (“domains”): intracellular and extracellular. Both spaces are anisotropic; the electrical conductivity depends on the direction relative to the myocardial fibers. Moreover, the intracellular space is more anisotropic than the extracellular space, a condition referred to in the literature as “unequal anisotropy ratios.” This condition has important consequences for the electrical behavior of the heart.

Many papers describe the implications of unequal anisotropy ratios. The mathematical derivations and numerical calculations in these reports emphasize the consequences of unequal anisotropy ratios, but they often fail to explain physically why these consequences occur. For example, Sepulveda et al. discovered that during unipolar stimulation, depolarization occurs under the cathode but hyperpolarization exists adjacent to it along the fiber direction. The hyperpolarized regions affect the mechanism of excitation, the shape of the strength-interval curve, and the induction of reentry. Yet, when I am asked why the hyperpolarization appears, I find it difficult to give an intuitive, nonmathematical answer.

In this paper, I try to answer the “why” questions that arise from the bidomain model. I present no new results, but many old results are clarified. My hope is that the reader will develop the intuition necessary to understand qualitatively how cardiac tissue behaves, without having to resort to lengthy mathematical derivations or numerical calculations.
Parts of this article have worked their way into Intermediate Physics for Medicine and Biology. For instance, the article explains how a wave front propagating through cardiac tissue creates a magnetic field. This analysis is reproduced as Problem 19 in Chapter 8 on biomagnetism.

Problem 50 in Chapter 7 examines the transmembrane potential induced in cardiac tissue when an electric shock is applied in the presence of an insulating obstacle. I love how this example highlights the importance of unequal anisotropy ratios.
Consider an insulating cylinder in an otherwise uniform tissue with straight fibers (Fig. 7). An electric field is applied from left to right. Far from the insulator, the current is in the x-direction and is distributed equally between the intracellular and extracellular spaces. As current approaches the insulator, it turns left to circle around the obstacle. The current then is flowing approximately perpendicular to the fibers, so most of the current will be extracellular. As the current turns right to flow once again in the x-direction, it will be parallel to the fibers and will again be distributed more or less equally between the two spaces. As current leaves and then reenters the intracellular space, it causes depolarization and then hyperpolarization. The transmembrane potential distribution surrounding the insulator is even in y and odd in x. The result is the complex pattern of polarization surrounding an insulator in cardiac tissue during electrical stimulation.
A figure from “How to explain why unequal anisotropy ratios is important using pictures but no mathematics,” showing how polarization is caused by an insulating obstacle.
Fig. 7. Distribution: Polarization caused by an insulating obstacle.
This figure explains the results observed in [18].
The role of theoretical analysis in biology and medicine is to make predictions that can be tested experimentally. My former PhD advisor John Wikswo and his team used optical mapping to measure the transmembrane potential around an obstacle during a shock. Their results are shown in the picture below. The bottom line: the prediction and the experiment are consistent. Physics works!

Optical mapping to measure the transmembrane potential around an obstacle during a shock, from: Woods et al. "Virtual Electrode Effects Around an Artificial Heterogeneity During Field Stimulation of Cardiac Tissue" (Heart Rhythm, 3:751-752, 2006).
Optical mapping to measure the transmembrane potential around an obstacle during a shock,
from: Woods et al. (Heart Rhythm, 3:751-752, 2006).
One graduate student, Marcella Woods, was involved in both of the projects I mentioned. She performed the theoretical analysis of the magnetic field produced by wave fronts in cardiac muscle under my direction when I was on the faculty of Vanderbilt University. After I left, she worked with Wikswo and carried out the experiments shown above.

Friday, December 4, 2015

A Mathematical Model of Make and Break Electrical Stimulation of Cardiac Tissue by a Unipolar Anode or Cathode

The first page of A Mathematical Model of Make and Break Electrical Stimulation of Cardiac Tissue by a Unipolar Anode or Cathode (IEEE Transactions on Biomedical Engineering, 42:1174–1184. 1995).
“A Mathematical Model of Make and Break
Electrical Stimulation of Cardiac Tissue
by a Unipolar Anode or Cathode.”
Suppose I was going to die tomorrow and I could choose only one paper to cite on my tombstone. Which would I pick? I’d select
B. J. Roth, 1995, “A Mathematical Model of Make and Break Electrical Stimulation of Cardiac Tissue by a Unipolar Anode or Cathode,” IEEE Transactions on Biomedical Engineering, Volume 42, Pages 1174–1184.
Below is the introduction, with references removed. I like the way it starts with a question.
What is the mechanism by which an electrical current, passed through a unipolar electrode, excites cardiac tissue? This simple question appears to have a straightforward answer: The stimulus current depolarizes the tissue under the electrode until the transmembrane potential reaches threshold, triggering an action potential wave front. Excitation of cardiac tissue, however, is more complicated than one might initially expect. Stimulation with a cathode might be explained by depolarization of the tissue under the electrode, but how does one explain stimulation with an anode? Even more intriguing, excitation is elicited by turning a stimulus off (break) as well as by turning it on (make). Why should turning off the stimulus excite the tissue? Indeed, four distinct mechanisms are responsible for stimulation of cardiac tissue—cathode make, anode make, cathode break, and anode break—and only cathode-make stimulation can be explained by depolarization under the electrode. To understand the other three mechanisms, we make detailed calculations of the transmembrane potential distribution induced by current through a unipolar electrode. We have three goals: to explain the mechanisms of excitation qualitatively; to predict stimulation thresholds quantitatively; and to determine how the threshold varies with electrode size and with stimulus pulse duration and frequency.

Our calculations are based on the bidomain model of cardiac tissue, which is useful for predicting the transmembrane potential induced by an extracellularly applied electric field. The bidomain model is a two- or three-dimensional cable model that accounts for the resistance of both the intracellular and the extracellular spaces. Many of the most interesting and nonintuitive predictions of the bidomain model occur when the ratios of the electrical conductivities parallel to and perpendicular to the myocardial fibers in the intracellular and extracellular spaces differ. For instance, current that is passed through a point extracellular electrode into a two-dimensional bidomain with unequal anisotropy ratios induces adjacent areas of depolarization and hyperpolarization. Such a region of hyperpolarization near a cathode is called a virtual anode; a region of depolarization near an anode is called a virtual cathode. The existence of virtual anodes and cathodes is predicted by the bidomain model and is essential for three of the four mechanisms of stimulation. Recently, virtual anodes and cathodes were observed experimentally in cardiac tissue.
My use of the royal “we” seemed reasonable when I wrote the paper, but now it grates on my ear. According to Google Scholar, in the twenty years since I published this article it has been cited 169 times. In Intermediate Physics for Medicine and Biology, Russ Hobbie and I turned the prediction of break excitation of cardiac tissue into a homework problem (Chapter 7, Problem 48).

I did this research while working at the National Institutes of Health in Bethesda, Maryland. Sometimes on a slow afternoon I would sneak away from my desk and browse the stacks of the NIH library. One day I found a fascinating paper by Egbart Dekker, who measured the threshold for each of the four mechanisms of excitation (E. Dekker, 1970, “Direct Current Make and Break Thresholds for Pacemaker Electrodes on the Canine Ventricle,” Circulation Research, Volume 27, Pages 811–823.) Once I read Dekker’s article, I knew I could simulate this behavior using the then-new bidomain model and perhaps gain insight about mechanisms. At the time I was not well versed in mathematical models of the cardiac membrane kinetics with all their different ion currents, so I just used the Hodgkin-Huxley model of a nerve axon. A paper describing that study was unpublishable because who in their right mind would use a squid nerve axon model to represent a cardiac action potential? After the manuscript using the Hodgkin-Huxley model was rejected, I set to work learning about cardiac ion channel dynamics. I chose the Beeler-Reuter model, and the paper using the BR model (no, I did not choose that model because of my initials) was ultimately accepted for publication.

I sent a draft of my article to my PhD advisor, John Wikswo. He and his post doc Marc Lin immediately verified the model predictions experimentally (see their lovely paper: J. P. Wikswo, S. F. Lin, and R. A. Abbas, 1995, “Virtual Electrodes in Cardiac Tissue: A Common Mechanism for Anodal and Cathodal Stimulation,” Biophysical Journal, Volume 69, Pages 2195–2210). I remember the day Wikswo emailed me asking something like “what would you say if I told you the cathode make, cathode break, and anode make mechanisms all behave exactly as you predicted, but your anode break mechanism is totally wrong?” I began to panic, wondering how in the world I messed up, and sent Wikswo a frantic email asking for more details. His response was along the lines of “I asked ‘what would you say?’ I didn’t claim your prediction was actually wrong.” Ha, ha, ha; all four mechanisms were verified. Their paper was published the same month as mine and now has 300 citations. Your can read a layman’s account of this work in an article published in the Vanderbilt Register.

The figures in my original article were all black-and-white contour plots of action potential wave fronts propagating through the tissue. Wikswo had beautiful color figures in his paper. So, a few years later I “colorized” the figures, including them in a review article (B. J. Roth, S.-F. Lin and J. P. Wikswo, Jr., 1998, “Unipolar Stimulation of Cardiac Tissue,” Journal of Electrocardiology, Volume 31, Supplement, Pages 6–12). This always reminds me of how some of the classic old black-and-white movies have been colorized to look modern.

One reason I like publishing in the IEEE TBME is that they provide a short biographical sketch of the author. Below is my bio from 20 years ago. My how time flies.
Bradley J. Roth was raised in Morrison, Illinois. He received the B.S. degree from the University of Kansas in 1982, where he was a Summerfield Scholar and received the Stranathan Award from the Department of Physics and Astronomy. He received the Ph.D. degree in physics from Vanderbilt University.

From 1988-1995, he worked in the Biomedical Engineering and Instrumentation Program at the National Institutes of Health. One of his primary accomplishments while at NIH was the study of the bidomain model and its application to solving fundamental problems solving the interaction of applied electric fields with cardiac muscle. Using the results of numerical simulations, he has formulated mechanisms for stimulation, defibrillation, and the initiation of arrhythmias in the heart In September, 1995, he became the Robert T. Lagemann Assistant Professor of Living State Physics at Vanderbilt University.

Friday, November 6, 2015

The Magnetic Field of a Single Axon (Part 2)

In my last blog entry, I began the story behind “The Magnetic Field of a Single Axon: A Comparison of Theory and Experiment” (Biophysical Journal, Volume 48, Pages 93–109, 1985). I wrote this paper as a graduate student working for John Wikswo at Vanderbilt University. (I use the first person “I” in this blog post because I was usually alone in a windowless basement lab when doing the experiment, but of course Wikswo taught me how to do everything including how to write a scientific paper.) Last week I described how I measured the transmembrane potential of a crayfish axon, and this week I explain how I measured its magnetic field.

A toroid used to measure the magnetic field of a single axon.
A toroid used to measure
the magnetic field of a single axon.
The magnetic field was recorded using a wire-wound toroid (I have talked about winding toroids previously in this blog). Wikswo had obtained several ferrite toroidal cores of various sizes, most a few millimeters in diameter. I wound 50 to 100 turns of 40-gauge magnet wire onto the core using a dissecting microscope and a clever device designed by Wikswo to rotate the core around several axes while holding its location fixed. I had to be careful because a kink in a wire having a diameter of less than 0.1 mm would break it. Many times after successfully winding, say, 30 turns the wire would snap and I would have to start over. After finishing the winding, I would carefully solder the ends of the wire to a coaxial cable and “pot” the whole thing in epoxy. Wikswo—who excels at building widgets of all kinds—had designed Teflon molds to guide the epoxy. I would machine the Teflon to the size we needed using a mill in the student shop. (With all the concerns about liability and lawsuits these days student shops are now uncommon, but I found it enjoyable, educational, and essential.) Next I would carefully place the wire-wound core in the mold with a Teflon tube down its center to prevent the epoxy from sealing the hole in the middle. This entire mold/core/wire/cable would then be placed under vacuum (to prevent bubbles), and filled with epoxy. Once the epoxy hardened and I removed the mold, I had a “toroid”: an instrument for detecting action currents in a nerve. In 1984, this “neuromagnetic current probe” earned Wikswo an IR-100 award. The basics of this measurement are described in Chapter 8 of Intermediate Physics for Medicine and Biology.

In Wikswo’s original experiment to measure the magnetic field of a frog sciatic nerve (the entire nerve; not just a single axon), the toroid signal was recorded using a SQUID magnetometer (see Wikswo, Barach, Freeman, “Magnetic Field of a Nerve Impulse: First Measurements,” Science, Volume 208, Pages 53–55, 1980). By the time I arrived at Vanderbilt, Wikswo and his collaborators had developed a low-noise, low-input impedance amplifier—basically a current-to-voltage converter—that was sensitive enough to record the magnetic signal (Wikswo, Samson, Giffard, “A Low-Noise Low Input Impedance Amplifier for Magnetic Measurements of Nerve Action Currents,” IEEE Trans. Biomed. Eng. Volume 30, Pages 215–221, 1983). Pat Henry, then an instrument specialist in the lab, ran a cottage industry building and improving these amplifiers.

To calibrate the instrument, I threaded the toroid with a single turn of wire connected to a current source that output a square pulse of known amplitude and duration (typically 1 μA and 1 ms). The toroid response was not square because we sensed the rate-of-change of the magnetic field (Faraday’s law), and because of the resistor-inductor time constant of the toroid. Therefore, we had to adjust the signal using “frequency compensation”; integrating the signal until it had the correct square shape.

The amplifier output was recorded by a digital oscilloscope that saved the data to a tape drive. Another of my first jobs at Vanderbilt was to write a computer program that would read the data from the tape and convert it to a format that we could use for signal analysis. We wrote our own signal processing program—called OSCOPE, somewhat analogous to MATLAB—that we used to analyze and plot the data. I spent many hours writing subroutines (in FORTRAN) for OSCOPE so we could calculate the magnetic field from the transmembrane potential, and vice versa.

A drawing of the experiment to measure the transmembrane potential, the extracellular potential, and the magnetic field of a single axon.
An experiment to measure the
transmembrane potential, the extracellular potential,
and the magnetic field of a single axon.
Once all the instrumentation was ready, the experiment itself was straightforward. I would dissect the ventral nerve cord from a crayfish and place it in a plexiglass bath (again, machined in the student shop) filled with saline (or more correctly, a version of saline for the crayfish called van Harreveld’s solution). The nerve was gently threaded through the toroid, a microelectrode was poked into the axon, and an electrode to record the extracellular potential was placed nearby. I would then stimulate the end of the nerve. It was easy to excite just a single axon; the nerve cord split to go around the esophagus, so I could place the stimulating electrode there and stimulate either the left or right half. In addition, the threshold of the giant axon was lower than that of the many small axons, so I could adjust the stimulator strength to get just one giant axon.

The magnetic field of a single axon. The data was recorded with no averaging.
The magnetic field of a single axon.
When I first started doing these experiments, I had a horrible time stimulating the nerve. I assumed I was either crushing or stretching it during the dissection, or there was something wrong with the saline solution, or the epoxy was toxic. But after weeks of checking every possible problem, I discovered that the coaxial cable leading to the stimulating electrode was broken! The experiment had been ready to go all along; I just wasn’t stimulating the nerve. Frankly, I now believe it was a blessing to have a stupid little problem early in the experiment that forced me to check every step of the process, eliminating many potential sources of trouble and giving me a deeper understanding of all the details. 

As you can tell, a lot of effort went into this experiment. Many things could, and did, go wrong. But the work was successful in the end, and the paper describing it remains one of my favorites. I learned much doing this experiment, but probably the most important thing I learned was perseverance.

Friday, October 30, 2015

The Magnetic Field of a Single Axon (Part 1)

The Magnetic Field of a Single Axon: A Comparison of Theory and Experiment (Biophysical Journal, 48:93–109, 1985)..
“The Magnetic Field of a Single Axon.”
Thirty years ago, John Wikswo and I published “The Magnetic Field of a Single Axon: A Comparison of Theory and Experiment” (Biophysical Journal, Volume 48, Pages 93–109, 1985). This was my second journal article (and my first as first author). Russ Hobbie and I cite it in Chapter 8 of the 5th edition of Intermediate Physics for Medicine and Biology. I reproduce the introduction below.
An active nerve axon can be modeled with sufficient accuracy to allow a detailed calculation of the associated magnetic field. Therefore the single axon provides a simple, yet fundamentally important system from which we can test our understanding of the relation between biomagnetic and bioelectric fields. The magnetic field produced by a propagating action potential has been calculated from the transmembrane action potential using the volume conductor model (1). The purpose of this paper is to verify that calculation experimentally. To make an accurate comparison between theory and experiment, we must be careful to correct for all systematic errors present in the data.

To test the volume conductor model it is necessary to measure the transmembrane potential and magnetic field simultaneously. An experiment performed by Wikswo et al. (2) provided preliminary data from a lobster axon, however the electric and magnetic signals were recorded at different positions along the axon and no quantitative comparisons were made between theory and experiment. In the experiment reported here, these limitations were overcome and improved instrumentation was used (3–5).
As the introduction notes, the volume conductor model was described in reference (1), which is an article by Jim Woosley, Wikswo and myself (“The Magnetic Field of a Single Axon: A Volume Conductor Model,” Mathematical Biosciences, Volume 76, Pages 1–36, 1985). I have discussed the calculation of the magnetic field previously in this blog, so today I’ll restrict myself to the experiment.

I was not the first to measure the magnetic field of a single axon. Wikswo’s student, J. C. Palmer, had made preliminary measurements using a lobster axon; reference (2) is to their earlier paper. One of the first tasks Wikswo gave me as a new graduate student was to reproduce and improve Palmer’s experiment, which meant I had to learn how to dissect and isolate a nerve. Lobsters were too expensive for me to practice with so I first dissected cheaper crayfish nerves; our plan was that once I had gotten good at crayfish we would switch to the larger lobster. I eventually became skilled enough in working with the crayfish nerve, and the data we obtained was good enough, that we never bothered with the lobsters.

I had to learn several techniques before I could perform the experiment. I recorded the transmembrane potential using a glass microelectrode. The electrode is made starting with a glass tube, about 1 mm in diameter. We had a commercial microelectrode puller, but it was an old design and had poor control over timing. So, one of my jobs was to design the timing circuitry (see here for more details). The glass would be warmed by a small wire heating element (much like you have in a toaster, but smaller), and once the glass was soft the machine would pull the two ends of the tube apart. The hot glass stretched and eventually broke, providing two glass tubes with long, tapering tips with a hole at the narrow end of about 1 micron diameter. I would then backfill these tubes with 2 Molar potassium citrate. The concentration was so high that when I occasionally forgot to clean up after an experiment I would comeback the next day and find the water had evaporated leaving impressive, large crystals. The back end of the glass tube would be put into a plexiglass holder that connected the conducting fluid to a silver-chloride electrode, and then to an amplifier.

One limitation of these measurements was the capacitance between the microelectrode and the perfusing bath. Because the magnetic measurements required that the nerve be completely immersed in saline, I could not reduce the stray capacitance by lowering the height of the bath. This capacitance severely reduced the rate of rise of the action potential, and to correct for it we used “negative capacitance.” We applied a square voltage pulse to the bath, and measured the microelectrode signal. We then adjusted the frequency compensation knob on the amplifier (basically, a differentiator) until the resulting microelectrode signal was a square pulse. That was the setting we used for measuring the action potential. Whenever I changed the position of the electrode or the depth of the bath, I had to recalibrate the negative capacitance.

To record the transmembrane potential, I would poke the axon (easy to see under a dissecting microscope) with a microelectrode. Often the tip of the electrode would not enter the axon, so I would tap on the lab bench creating a vibration that was just sufficient to drive the electrode through the membrane. Usually I had the output of the microelectrode amplifier go to a device that output current with a frequency that varied with the microelectrode voltage. I’d put this current through a speaker, so I could listen for when the microelectrode tip was successfully inside the axon because the DC potential would drop by about 70 mV (the axon’s resting potential) and therefore the pitch of the speaker would suddenly drop.

Next week I will continue this story, describing how we measured the magnetic field.

The transmembrane potential, measured with a glass microelectrode from a single axon.
The measured transmembrane potential.

Friday, August 28, 2015

Art Winfree and the Bidomain Model of Cardiac Tissue

Art Winfree was a pioneer in applying physics and mathematics to cardiac electrophysiology. Russ Hobbie and I cite him often in the 5th edition of Intermediate Physics for Medicine and Biology. After his untimely death in 2002, I was asked to write an article for a special issue of the Journal of Theoretical Biology published in his honor. My paper, “Art Winfree and the Bidomain Model of Cardiac Tissue,” appeared in 2004.

My original submission for the special issue was a personal tribute to Art. It began
“Spiral waves have become so popular in Tucson they are even sold in hair styling salons (Figure 1)”
A photograph in a preprint from Art Winfree, with the caption "Spiral waves have become so popular in Tucson they are even sold in hair styling salons (Figure 1)"
Figure 1.
I had to laugh as I read the above quote in a preprint Art Winfree sent me. It was to be the opening sentence of a chapter appearing in a prestigious textbook on cardiac electrophysiology. Unfortunately, the sentence and the picture were deleted before the book's publication, although the picture (Fig. 1) did appear eventually in the second edition of Art’s The Geometry of Biological Time. For me, the quote captures the essence of Art: his humor, his irreverence, and his uncanny ability to find science in the world around him. I only met Art in person once, but we corresponded often by email, exchanging ideas, frustrations, and gossip. Of all the scientists who have influenced my research career, only my PhD advisor John Wikswo had a greater impact than Art Winfree did. In this paper, I describe several instances where my path crossed Art’s as we each attacked related problems in cardiac electrophysiology. In addition, I hope to show that Art made important contributions to what is known as the “bidomain model” of cardiac tissue.
Later in the article is one of my favorite passages.
I recall vividly a sunny day in April, soon after my second daughter Katherine was born. I was sitting on a rocking chair in the living room of our house in Kensington, Maryland, holding the sleeping infant in one arm and Art’s book When Time Breaks Down in the other. Outside I could see our dogwood tree in full blossom. As I read page after page, I remember thinking “life doesn’t get any better than this.” The book (and the daughter) changed my life.
Unfortunately, the editors of the special issue didn’t like my paper, saying they wanted a more traditional review article. In particular, they objected to my quoting Art’s emails he had sent me. So, I gave the paper a lobotomy and published a harmless but lifeless review. When the issue came out, I found a wonderful article by George Oster about Winfree, full of personal insights and even the text of one of Art’s emails. I wish now I had pushed harder to get my article published in its original form. The best article in the special issue was “Art Winfree, Artist of Science” by his daughter Rachael Winfree.

In the acknowledgments of my paper is the line “I would like to thank Jesse Malouf for his help editing this paper.” Jesse was a student in my honors college course about Pacemakers and Defibrillators. At Oakland University, Honors College has many of the best students in the university, but they are from all backgrounds and often have weak math skills. Jesse was a mathaphobe, but a wonderful writer. On one of my exams I had a mixture of questions, some requiring mathematical analysis and others needing an essay. Jesse skipped the math questions, but to make up for it he not only answered all the essay questions elegantly but also wrote a “bonus essay”. I never had a student hand in a bonus essay before! The next semester, I hired him to help me write the Winfree article. I fear many of his contributions to the original version were not included in the published one.

In the “olden days” the original draft of my Winfree article would be lost forever, or maybe would sit in some file cabinet unseen for decades. But nowadays, you can find anything on the internet (how did we live without it?). I have posted the original submission on my ResearchGate page. You can find it here.

Friday, March 6, 2015

A Mathematical Model of Agonist-Induced Propagation of Calcium Waves in Astrocytes

When I was working at the National Institutes of Health in the mid-1990s, I spent most of my time studying transcranial magnetic stimulation and theoretical cardiac electrophysiology. But also I collaborated with James Russell to study calcium waves in astrocytes (a type of glial cell in the brain), and we published a paper in the journal Cell Calcium describing “A Mathematical Model of Agonist-Induced Propagation of Calcium Waves in Astrocytes” (Volume 17, Pages 53–64, 1995). The introduction is reproduced below (with citations removed):
Recent experiments have clearly shown that astroglia in brain participate in long distance signaling together with neurons. Such signalling in astrocytes is supported by intracellular calcium oscillations induced by neurotransmitters that are propagated as waves through the cytoplasm of individual cells and through astrocyte networks. These calcium oscillations generally are triggered by activation of metabotropic receptors which are coupled to inositol 1,4,5-trisphosphate (IP3) generation and intracellular calcium release through IP3-gated calcium channels on the endoplasmic reticulum (ER) membrane. Yagodin et al. have shown that, in astrocytes, wave propagation is saltatory, with discrete loci of nonlinear wave amplification separated by regions through which passive diffusion of calcium occurs. These wave amplification loci appear to be intracellular specializations that remain invariant and support a qualitatively characteristic response pattern in any given cell. The loci may each have different intrinsic oscillatory frequencies, resulting in complex spatio-temporal dynamics, with wave collisions and annihilations.

Several mathematical models have been presented that describe the temporal characteristics of agonist-induced calcium oscillations in different types of cells. A few of these models address the spatial characteristics of wave propagation, but none have addressed the complex wave dynamics observed in different types of cells including astrocytes. The purpose of this paper is to extend a previously developed model of calcium oscillations so that it includes spatial diffusion of calcium in a cell with discrete active loci of wave amplification. This model is then used to analyze experimental data and to gain insight into the mechanism of wave collisions and annihilations.
As you might expect, my contribution to this paper was developing the mathematical model, while Russell and his team provided the experimental data as well as the biological knowledge and insight. The model was based on a paper by Li and Rinzel (“Equations for InsP3 Receptor-Mediated [Ca2+]i Oscillations Derived from a Detailed Kinetic Model: A Hodgkin-Huxley Like Formalism,” Journal of Theoretical Biology, Volume 166, Pages 461–473, 1994). At that time, John Rinzel was at NIH, heading the Mathematical Research Branch of the National Institute of Diabetes and Digestive and Kidney Diseases. John, now at the Center for Neural Science at New York University, has contributed much to theoretical biology, but I remember him best for his work on bursting of pancreatic beta cells. He is this year’s winner of the Society of Mathematical Biology’s Arthur T. Winfree Prizefor his elegant work on the analysis of dynamical behavior in models of neural activity and the contributions that work has made in the neurobiological community to the understanding of a host of phenomena (including simple excitability as well as bursting) in single neurons, small populations of neurons, and other excitable cells.”

Russell remains at NIH with the Microscopy and Imaging Core of the Eunice Kennedy Shriver National Institute of Child Health and Development. He leads a multi-user research facility providing training and instrumentation for high resolution microscopy and image processing.

As so often happens, an echo of my work on calcium wave modeling with Russell appears in the 4th edition of Intermediate Physics for Medicine and Biology. Homework Problem 24 in Chapter 4 contains a simplified model of calcium waves. This system is a classic “reaction-diffusion” system: calcium diffuses down the cell, triggering calcium-induced calcium release, which produces more diffusion, triggering more calcium release, resulting in positive feedback and a calcium wave. The process is analogous to action potential propagation along a nerve.

Friday, January 30, 2015

Electron Paramagnetic Resonance Imaging

Magnetic resonance comes in two types: nuclear magnetic resonance and electron paramagnetic resonance. In Chapter 18 of the 4th edition of Intermediate Physics for Medicine and Biology, Russ Hobbie and I write
Two kinds of spin measurements have biological importance. One is associated with electron magnetic moments and the other with the magnetic moments of nuclei. Most neutral atoms in their ground state have no magnetic moment due to the electrons. Exceptions are the transition elements that exhibit paramagnetism. Free radicals, which are often of biological interest, have an unpaired electron and therefore have a magnetic moment. In most cases this magnetic moment is due almost entirely to the spin of the unpaired electron.

Magnetic resonance imaging is based on the magnetic moments of atomic nuclei in the patient. The total angular momentum and magnetic moment of an atomic nucleus are due to the spins of the protons and neutrons, as well as any orbital angular momentum they have inside the nucleus. Table 18.1 lists the spin and gyromagnetic ratio of the electron and some nuclei of biological interest.
The key insight from Table 18.1 is that the Larmor frequency for an electron in a magnetic field is about a thousand times higher than for a proton. Therefore, MRI works at radio frequencies, whereas EPR imaging is at microwave frequencies. Can electron paramagnetic resonance be used to make images like nuclear magnetic resonance can? I should know the answer to this question, because I hold two patents about a “Pulsed Low Frequency EPR Spectrometer and Imager” (U.S. Patents 5,387,867 and 5,502,386)!

I’m not particularly humble, so when I tell you that I didn’t contribute much to developing the EPR imaging technique described in these patents, you should believe me. The lead scientist on the project, carried out at the National Institutes of Health in the mid 1990s, was John Bourg. John was focused intensely on developing an EPR imager. Just as with magnetic resonance imaging, his proposed device needed strong magnetic field gradients to map spatial position to precession frequency. My job was to design and build the coils to produce these gradients. The gradients would need to be strong, so the coils would get hot and would have to be water cooled. I worked on this with my former boss Seth Goldstein, who was a mechanical engineer and therefore know what he was doing in this design project. Suffice to say, the coils never were built, and from my point of view all that came out of the project was those two patents (which have never yielded a dime of royalties, at least that I know of). This project was probably the closest I ever have come to doing true mechanical engineering, even though I was a member of the Mechanical Engineering Section when I worked in the Biomedical Engineering and Instrumentation Program at NIH.

One of our collaborators, Sankaran Subramanian, continued to work on this project for years after I left NIH. In a paper in Magnetic Resonance Insights, Subramanian describes his work in “Dancing With The Electrons: Time-Domain and CW In Vivo EPR Imaging” (Volume 2, Pages 43–74, 2011). Below is an excerpt from the introduction of his article, with references removed. It provides an overview of the advantages and disadvantages of EPR imaging compared to MRI.
Magnetic resonance spectroscopy, in general, deals with the precessional frequency of magnetic nuclei, such as 1H, 13C, 19F, 31P, etc. and that of unpaired electrons in free radicals and systems with one or more unpaired electrons when placed in a uniform magnetic field. The phenomena of nuclear induction and electron resonance were discovered more or less at the same time, and have become two of the most widely practiced spectroscopic techniques. The finite dimensional spin space of magnetic nuclei makes it possible to quantum mechanically precisely predict how the nuclear spin systems will behave in a magnetic field in presence of radiofrequency fields. On the other hand, the complex and rather diffuse wave functions of the unpaired electron which get further influenced by the magnetic vector potential make it a real challenge to predict the precise behavior of electron resonance systems. The subtle variations in the precessional frequencies brought about by changes in the electronic environment of the magnetic nuclei in NMR and that of the unpaired electrons in EPR make the two techniques widely practiced and very useful in the structural elucidation of complex biomolecules. It was discovered subsequently that the presence of linear field gradients enabled precise spatial registration of nuclear spins which led to the development of imaging of the distribution of magnetic nuclei establishing an important non-invasive medical imaging modality of water-rich soft tissues in living systems with its naturally abundant presence of protons. Nuclear Magnetic Resonance Imaging, popularly known as MRI, is now a well-known and indispensable tool in diagnostic radiology. …

The entirely analogous field of electron paramagnetic (spin) resonance (EPR or ESR) that deals with unpaired electron systems developed as a structural tool much more rapidly with the intricate spectra of free radicals and metal complexes providing an abundance of precise structural information on molecules, that would otherwise be impossible to unravel. The spectroscopic practice of EPR traditionally started in the microwave region of the electromagnetic spectrum and was essentially a physicist’s tool to study magnetic properties and the structure of paramagnetic solid state materials, crystal defects (color centers), etc. Later, chemists started using EPR to unravel the structure of organic free radicals and paramagnetic transition metal and lanthanide complexes. Early EPR instrumentation closely followed the development of radar systems during the Second World War and was operating in the X-band region of the electromagnetic spectrum (~9 GHz). Pulsed EPR methods developed somewhat later due to the requirement of ultra fast switches and electronic data acquisition systems that can cope with three orders of magnitude faster dynamics of the electrons, compared to that of protons. The absence of relatively long-lived free radicals of detectable range of concentration in living systems made in vivo EPR imaging not practical. It became essential that one has to introduce relatively stable biocompatible free radicals as probes into the living system in order to image their distribution. Further the commonly practiced X-band EPR frequency is not useful for interrogating reasonable size of aqueous systems due lack of penetration. Frequencies below L-band (1–2 GHz) are needed for sufficient penetration and one has to employ either water soluble spin probes that can be introduced into the living system (via intramuscular or intravenous infusion) or solid particulate free radicals that can be implanted in vivo. Early imaging attempts were entirely in the CW mode at L-band frequencies (1–2 GHz) on small objects. For addressing objects such a laboratory mouse, rat etc., it became necessary to lower the frequency down to radiofrequency (200–500 MHz). With CW EPR imaging, the imaging approach is one of generating projections in presence of static field gradients and reconstructing the image via filtered back-projection as in X-ray CT or positron emission tomography (PET). Most spin probes used for small animal in vivo imaging get metabolically and/or renally cleared within a short time and hence there is need to speed up the imaging process. Further, the very fast dynamics, with relaxation times on the order of microseconds of common stable spin probes such as nitroxides, until recently, precluded the use of pulsed methods that are in vogue in MRI.
As a postscript, Seth Goldstein retired from NIH and now creates kinetic sculpture. Watch some of these creative devices here.

Friday, December 12, 2014

In Vitro Evaluation of a 4-leaf Coil Design for Magnetic Stimulation of Peripheral Nerve

In the comments to last week’s blog entry, Frankie asks if there is a way to “safely, reversibly block nerve conduction (first in the lab, then in the clinic) with an exogenously applied E and M signal?” This is a fascinating question, and I may have an answer.

When working at the National Institutes of Health in the early 1990’s, Peter Basser and I analyzed magnetic stimulation of a peripheral nerve. The mechanism of excitation is similar to the one Frank Rattay developed for stimulating a nerve axon with an extracellular electrode. You can find Rattay’s method described in Problems 38–41 of Chapter 7 in the 4th edition of Intermediate Physics for Medicine and Biology. The bottom line is that excitation occurs where the spatial derivative of the electric field is largest. I have already recounted how Peter and I derived and tested our model, so I won’t repeat it today.

If you accept the hypothesis that excitation occurs where the electric field derivative is large, then the traditional coil design for magnetic stimulation—a figure-of-eight coil—has a problem: the axon is not excited directly under the center of the coil (where the electric field is largest), but a few centimeters from the center (where the electric field gradient is largest). What a nuisance. Doctors want a simple design like a crosshair: excitation should occur under the center. X marks the spot.

As I pondered this problem, I realized that we could build a coil just like the doctor ordered. It wouldn’t have a figure-of-eight design. Rather, it would be two figure-of-eights side by side. I called this the four leaf coil. With this design, excitation occurs directly under the center.

An x-ray of a four-leaf-coil used for magnetic stimulation of nerves.
A four-leaf-coil used for
magnetic stimulation of nerves.
John Cadwell of Cadwell Labs built a prototype of this coil; an x ray of it is shown above. We wanted to test the coil in a well-controlled animal experiment, so we sent it to Paul Maccabee at the State University of New York Health Science Center in Brooklyn. Paul did the experiments, and we published the results in the journal Electroencephalography and clinical Neurophysiology (Volume 93, Pages 68–74, 1994). The paper begins
Magnetic stimulation is used extensively for non-invasive activation of human brain, but is not used as widely for exciting limb peripheral nerves because of both the uncertainty about the site of stimulation and the difficulty in obtaining maximal responses. Recently, however, mathematical models have provided insight into one mechanism of peripheral nerve stimulation: peak depolarization occurs where the negative derivative of the component of the induced electric field parallel to nerve fibers is largest (Durand et al. 1989; Roth and Basser 1990). Both in vitro (Maccabee et al. 1993) and in vivo (Nilsson et al. 1992) experiments support this hypothesis for uniform, straight nerves. Based on these results, a 4-leaf magnetic coil (MC) design has been suggested that would provide a well defined site of stimulation directly under the center of the coil (Roth et al. 1990). In this note, we perform in vitro studies which test the performance of this new coil design during magnetic stimulation of a mammalian peripheral nerve.
Maccabee’s experiments showed that the coil worked as advertised. In the discussion of the paper we concluded that “the 4-leaf coil design provides a well defined stimulus site directly below the center of the coil.”

This is a nice story, but it’s all about exciting an action potential. What does it have to do with Frankie’s goal of blocking an action potential? Well, if you flip the polarity of the coil current, instead of depolarizing the nerve under the coil center, you hyperpolarize it. A strong enough hyperpolarization should block propagation. We wrote
In a final type of experiment, performed on 3 nerves, the action potential was elicited electrically, and a hyperpolarizing magnetic stimulus was applied between the stimulus and recording sites at various times. The goal was to determine if a precisely timed stimulus could affect action potential propagation. Using induced hyperpolarizing current at the coil center, with a strength that was approximately 3 times greater than that needed to excite by depolarization at that location, we never observed a block of the action potential. Moreover, no significant effect on the latency of the action potential propagating to the recording site was observed… Our magnetic stimulator was able to deliver stimuli with strengths up to only 2 or 3 times the threshold strength, and therefore the magnetic stimuli were probably too weak to block propagation. It is possible that such phenomena might be observed using a more powerful stimulator.
Frankie, I have good news and bad news. The good news is that you should be able to reversibly block nerve conduction with magnetic stimulation using a four-leaf coil. The bad news is that it didn’t work with Paul’s stimulator; perhaps a stronger stimulator would do the trick. Give it a try.

Friday, December 5, 2014

The Bubble Experiment

When I was a graduate student, my mentor John Wikswo assigned to me the job of measuring the magnetic field of a nerve axon. This experiment required me to dissect the ventral nerve cord out of a crayfish, thread it through a wire-wound ferrite-core toroid, immerse the nerve and toroid in saline, stimulate one end of the nerve, and record the magnetic field produced by the propagating action currents. One day as I was lowering the instrument into the saline bath, a bubble got stuck in the gap between the nerve and the inner surface of the toroid. “Drat” I thought as I searched for a needle to remove it. But before I could poke it out I wondered “how will the bubble affect the magnetic signal?”

A drawing of a wire-wound ferrite-core toroid, used to measure the magnetic field of a nerve axon.
A wire-wound, ferrite-core toroid,
used to measure the magnetic field of a nerve.

To answer this question, we need to review some magnetism. Ampere’s law states that the line integral of the magnetic field around a closed path is proportional to the net current passing through a surface bounded by that path. For my experiment, that meant the magnetic signal depended on the net current passing through the toroid. The net current is the sum of the current inside the nerve axon and that fraction of the current in the saline bath that threads the toroid—the return current. In general, these currents flow in opposite directions and partially cancel. One of the difficulties I faced when interpreting my data was determining how much of the signal was from intracellular current and how much was from return current.

I struggled with this question for months. I calculated the return current with a mathematical model involving Fourier transforms and Bessel functions, but the calculation was based on many assumptions and required values for several parameters. Could I trust it? I wanted a simpler way to find the return current.

Then along came the bubble, plugging the toroid like Pooh stuck in Rabbit’s front door. The bubble blocked the return current, so the magnetic signal arose from only the intracellular current. I recorded the magnetic signal with the bubble, and then—as gently as possible—I removed the bubble and recorded the signal again. This was not easy, because surface tension makes a small bubble in water sticky, so it stuck to the toroid as if glued in place. But I eventually got rid of it without stabbing the nerve and ending the experiment.

To my delight, the magnetic field with the bubble was much larger than when it was absent. The problem of estimating the return current was solved; it’s the difference of the signal with and without the bubble. I reported this result in one of my first publications (Roth, B. J., J. K. Woosley and J. P. Wikswo, Jr., 1985, “An Experimental and Theoretical Analysis of the Magnetic Field of a Single Axon,” In: Biomagnetism: Applications and Theory, Weinberg, Stroink and Katila, Eds., Pergamon Press, New York, pp. 78–82.).
When taking data from a crayfish nerve, the toroid and axon were lifted out of the bath for a short time. […] When again placed in the bath an air bubble was trapped in the center of the toroid, filling the space between the axon and the toroid inner surface. […] Taking advantage of this fortunate occurrence, data were taken with and without the bubble present. […] The magnetic field with the bubble present […] is narrower and larger than the field with the toroid filled with saline.
A plot of magnetic field produced by a propagating action potential versus time. The two traces show measurements when a bubble was trapped between the toroid and the nerve ("Bubble") and when it was not ("No Bubble").
The magnetic field of a nerve axon
with and without a bubble trapped
between the nerve and toroid.
On the day of the bubble experiment I was lucky. I didn’t plan the experiment. I wasn’t wise enough or thoughtful enough to realize in advance that a bubble was the ideal way to eliminate the return current. But when I looked through the dissecting microscope and saw the bubble stuck there, I was bright enough to appreciate my opportunity. “Chance favors the prepared mind.”

I have a habit of turning all my stories into homework problems. You will find the bubble story in the 4th edition of Intermediate Physics for Medicine and Biology, Problem 39 of Chapter 8. Focus on part (b).
Problem 39 A coil on a magnetic toroid as in Problem 38 is being used to measure the magnetic field of a nerve axon.
(a) If the axon is suspended in air, with only a thin layer of extracellular fluid clinging to its surface, use Ampere’s law to determine the magnetic field, B, recorded by the toroid.
(b) If the axon is immersed in a large conductor such as a saline bath, B is proportional to the sum of the intracellular current plus that fraction of the extracellular current that passes through the toroid (see Problem 13). Suppose that during an experiment an air bubble is trapped between the axon and the inner radius of the toroid? How is the magnetic signal affected by the bubble? See Roth et al. (1985).

Friday, October 17, 2014

A Theoretical Model of Magneto-Acoustic Imaging of Bioelectric Currents

Twenty years ago, I became interested in magneto-acoustic imaging, primarily influenced by the work of Bruce Towe that was called to my attention by my dissertation advisor and collaborator John Wikswo. (See, for example, Towe and Islam, “A Magneto-Acoustic Method for the Noninvasive Measurement of Bioelectric Currents,” IEEE Trans. Biomed. Eng., Volume 35, Pages 892–894, 1988). The result was a paper by Wikswo, Peter Basser, and myself (“A Theoretical Model of Magneto-Acoustic Imaging of Bioelectric Currents,” IEEE Trans. Biomed. Eng., Volume 41, Pages 723–728, 1994). This was my first foray into biomechanics, a subject that has become increasingly interesting to me, to the point where now it is the primary focus of my research (but that’s another story; for a preview look here).

A Treatise on the Mathematical Theory of Elasticity, by A. E. H. Love, superimposed on Intermediate Physics for Medicine and BIology.
A Treatise on the Mathematical
Theory of Elasticity,
by A. E. H. Love.
I started learning about biomechanics mainly through my friend Peter Basser. We both worked at the National Institutes of Health in the early 1990s. Peter used continuum models in his research a lot, and owned a number of books on the subject. He also loved to travel, and would often use his leftover use-or-lose vacation days at the end of the year to take trips to exotic places like Kathmandu. When he was out of town on these adventures, he left me access to his personal library, and I spent many hours in his office reading classic references like Schlichting’s Boundary Layer Theory and Love’s A Treatise on the Mathematical Theory of Elasticity. Peter and I also would read each other’s papers, and I learned much continuum mechanics from his work. (NIH had a rule that someone had to sign a form saying they read and approved a paper before it could be submitted for publication, so I would give my papers to Peter to read and he would give his to me.) In this way, I became familiar enough with biomechanics to analyze magneto-acoustic imaging. Interestingly, we published our paper in the same year Basser began publishing his research on MRI diffusion tensor imaging, for which he is now famous (see here).

As with much of my research, our paper on magneto-acoustic imaging addressed a simple “toy model”: an electric dipole in the center of an elastic, conducting sphere exposed to a uniform magnetic field. We were able to calculate the tissue displacement and pressure analytically for the cases of a magnetic field parallel and perpendicular to the dipole. One of my favorite results in the paper was that we found a close relationship between magneto-acoustic imaging and biomagnetism.
“Magneto-acoustic pressure recordings and biomagnetic measurements image action currents in an equivalent way: they both have curl J [the curl of the current density] as their source.”
For about ten years, our paper had little impact. A few people cited it, including Amalric Montalibet and later Han Wen, who each developed a method to use ultrasound and the Lorentz force to generate electrical current in tissue. I’ve described this work before in a review article about the role of magnetic forces in medicine and biology, which I have mentioned before in this blog. Then, in 2005 Bin He began citing our work in a long list of papers about magnetoacoustic tomography with magnetic induction, which again I've written about previously. His work generated so much interest in our paper that in 2010 alone it was cited 19 times according to Google Scholar. Of course, it is gratifying to see your work have an impact.

But the story continues with a more recent study by Pol Grasland-Mongrain of INSERM in France. Building on Montalibet’s work, Grasland-Mongrain uses an ultrasonic pulse and the Lorentz force to induce a voltage that he can detect with electrodes. The resulting electrical data can then be analyzed to determine the distribution of electrical conductivity (see Ammari, Grasland-Mongrain, et al. for one way to do this mathematically). In many ways, their technique is in competition with Bin He’s MAT-MI as a method to image conductivity.

Grasland-Mongrain also publishes his own blog about medical imaging. (Warning: The website is in French, and I have to rely on Google Translate to read it. It is my experience that Google has a hard time translating technical writing). There he discusses his most recent paper about imaging shear waves using the Lorentz force. Interestingly, shear waves in tissue is one of the topics Russ Hobbie and I added to the 5th edition of Intermediate Physics for Medicine and Biology, due out next year. Grasland-Mongrain’s work has been highlighted in Physics World and Focus Physics, and a paper about it appeared this year in Physical Review Letters, the most prestigious of all physics journals (and one I’ve never published in, to my chagrin).

I am amazed by what can happen in twenty years.


As a postscript, let me add a plug for toy models. Russ and I use a lot of toy models in IPMB. Even though such simple models have their limitations, I believe they provide tremendous insight into physical phenomena. I recently reviewed a paper in which the authors had developed a very sophisticated and complex model of a phenomena, but examination of a toy model would have told them that the signal they calculated was far, far to small to be observable. Do the toy model first. Then, once you have the insight, make your model more complex.

Friday, December 6, 2013

A Simplified Approach for Simultaneous Measurements of Wavefront Velocity and Curvature in the Heart Using Activation Times

I am one of the coauthors on a paper published recently that analyzes how to determine properties of a cardiac wave front from measurements of wave front arrival times (Mazeh, Haines, Kay, and Roth, “A Simplified Approach for Simultaneous Measurement of Wavefront Velocity and Curvature in the Heart Using Activation Times,” Cardiovascular Engineering and Technology, Volume 4, Pages 520–534, 2013). The lead author, Nachaat Mazeh, is a former grad student of mine who obtained his PhD from Oakland University, and now works in the Beaumont Health System. David Haines is the Director of the Heart Rhythm Center at Beaumont, and is well known for his work on radiofrequency ablation of cardiac tissue. Matthew Kay is a professor of engineering at The George Washington University. In this paper, we obtain the wave front properties from measurement of four arrival times. The result is just simple enough to make into a new homework problem, typical in difficulty to those in the 4th edition of Intermediate Physics for Medicine and Biology.
Section 10.11

Problem 43 Suppose you measure the arrival time of an action potential wave front at four points (1-4) in a diamond pattern, each a distance b from the central point (red). Calculate the wave front speed, direction, and curvature from these four measurements.
A figure showing how to measure the speed, direction, and curvature of a cardiac wave front using four electrodes.

a) Assume the wave front is circular and propagates outward from the origin. Use the law of cosines to write r1, r2, r3, and r4 (the distance of each electrode to the origin) in terms of r0, b, and the angle θ.
b) Pull a factor of r0 outside of the square root in each of your four expressions from part a).
c) Assume r0 is much greater than b, and perform a Taylor expansion of each of the four expressions in terms of the small parameter ε = b/r0. Include terms that are constant, linear, and quadratic in ε.
d) Write the arrival time at each electrode (n=1, 2, 3, and 4) as tn=rn/v, where v is the wave speed.
e) Let Δtij=ti – tj. Find expressions for Δt13 and Δt24 in terms of b, θ, and v. Solve these expressions to determine v and θ in terms of Δt13, Δt24, and b.
f) Find expressions for Δt14 and Δt23 in terms of b, θ, and v. Now (and this is the most difficult step), find an expression for the radius of curvature, r0, in terms of b, Δt13, Δt24, Δt14, and Δt23.

There are several advantages and several disadvantages to the expressions you will derive. The advantages are that the calculations require only four measurements of arrival time, and they provide not only the speed and direction but also (somewhat unexpectedly--at least to me) the radius of curvature, r0. The radius of curvature is important for propagation, because highly curved wave fronts propagate more slowly than nearly flat wave fronts. The radius of curvature at the core of a spiral wave is highly curved, and this curvature influences properties of the spiral wave such as how fast it rotates. There are some important limitations. First, a close examination of your expression for the radius of curvature will reveal that the method gives an indeterminate expression for propagation at angles of θ = 45, 135, 225, and 315°. Second, the expressions contain the differences of activation times. In fact, the radius of curvature depends on the difference of a difference of activation times. If these activation times are all similar, then they need to be known precisely for the calculation of their differences to be accurate. The calculation assumes the wave front is circular, although really the wave front only needs to be circular locally, so this should not be too bad an approximation. The method also is based on the assumption that b is much less than r0.

Despite these limitations, I think the expressions should be useful for characterizing properties of wave fronts in the heart. It may be particularly useful for obtaining wave front speed, direction, and curvature in computer simulations, where the calculation is computed over a regular two-dimensional Cartesian grid and where noise in the activation times may not be a big concern.