Friday, December 25, 2015

The Royal Institution's 2015 Christmas Lecutres: How to Survive in Space

A picture of Michael Faraday lecturing at the Royal Institution.
Michael Faraday lecturing
at the Royal Institution.
190 years ago at the Royal Institution in London, Michael Faraday presented the first Christmas Lectures. These lectures about science have continued annually except during the worst years of World War II, and are now broadcast on television and online. Each year is a different topic, and this year the topic is How to Survive in Space.
In December 2015, Tim Peake will become the first Briton in space for more than 20 years and a new member of the European Astronaut Corps. As Tim adjusts to life on board the International Space Station (ISS), Kevin Fong’s CHRISTMAS LECTURES will take us on a journey from planet Earth into Low Earth Orbit and beyond. This is the story of human survival against all the odds; the story of how science, medicine and engineering come together to help answer our biggest questions about Life, the Earth, the Universe and our place in it.

From artificial gravity and greenhouses in space to plasma drives and zero-G surgical suits, the Lectures will reveal how what once was the stuff of science fiction is fast becoming today’s science fact.

Throughout the three-part series, Kevin will be accompanied by special guest appearances from ISS astronauts who will reveal what daily life is like 400 kilometres above the Earth, demonstrate the technology and techniques that help them stay safe and healthy, and explain the scientific experiments they are part of that are helping to stretch the limits of our understanding of human physiology and survival in a way that no experiment back on Earth could.
Intermediate Physics for Medicine and Biology does not address space medicine specifically, but many of the topics examined in these Christmas Lectures require a deep understanding of how physics and medicine interact. I plan to watch. The lectures will be first broadcast by the BBC on December 28, 29, and 30. I won’t be able to view them until they are posted afterward (hopefully, soon afterward) on the Ri Channel.

A Christmas Carol, by Charles Dickens, superimposed on Intermediate Physics for Medicine and Biology.
A Christmas Carol,
by Charles Dickens.
Because this year I’m posting on Christmas Day, I’ll conclude with a Christmas present—the final lines of my all-time favorite book (yes, even better that IPMB): A Christmas Carol, by Charles Dickens. I reread it every December.
Scrooge was better than his word. He did it all, and infinitely more; and to Tiny Tim, who did not die, he was a second father. He became as good a friend, as good a master, and as good a man, as the good old city knew, or any other good old city, town, or borough, in the good old world. Some people laughed to see the alteration in him, but he let them laugh, and little heeded them; for he was wise enough to know that nothing ever happened on this globe, for good, at which some people did not have their fill of laughter in the outset; and knowing that such as these would be blind anyway, he thought it quite as well that they should wrinkle up their eyes in grins, as have the malady in less attractive forms. His own heart laughed: and that was quite enough for him.

He had no further intercourse with Spirits, but lived upon the Total Abstinence Principle, ever afterwards; and it was always said of him, that he knew how to keep Christmas well, if any man alive possessed the knowledge. May that be truly said of us, and all of us! And so, as Tiny Tim observed, God bless Us, Every One!

Friday, December 18, 2015

Star Wars

With The Force Awakens opening in theaters, now is the perfect time to answer your questions about how Intermediate Physics for Medicine and Biology relates to Star Wars. (Warning: This post is spoiler laden for Episodes I - VI, but not for Episode VII which I haven’t seen yet.)


Luke and Vadar in a lightsaber duel, from Star Wars
1. With so many light saber duels, why is there so little blood? Even blasters kill without gore or carnage. In Section 14.11 of IPMB, Russ Hobbie and I discuss tissue ablation. According to Wookieepedia, ablation cauterizes wounds, preventing bleeding. This is the same reason we use lasers in surgery.

 
A storm trooper, from Star Wars.

2. Why do blaster shots not propagate at the speed of light? Chapter 14 of IPMB gives the speed of light as 3 × 10⁸ m/s. In Star Wars, shots travel not much faster than a hard-thrown fastball, maybe 100 m/s. Apparently this far-away galaxy has a large permeability of free space, μo. Next time you view these films, watch for exaggerated magnetic effects.

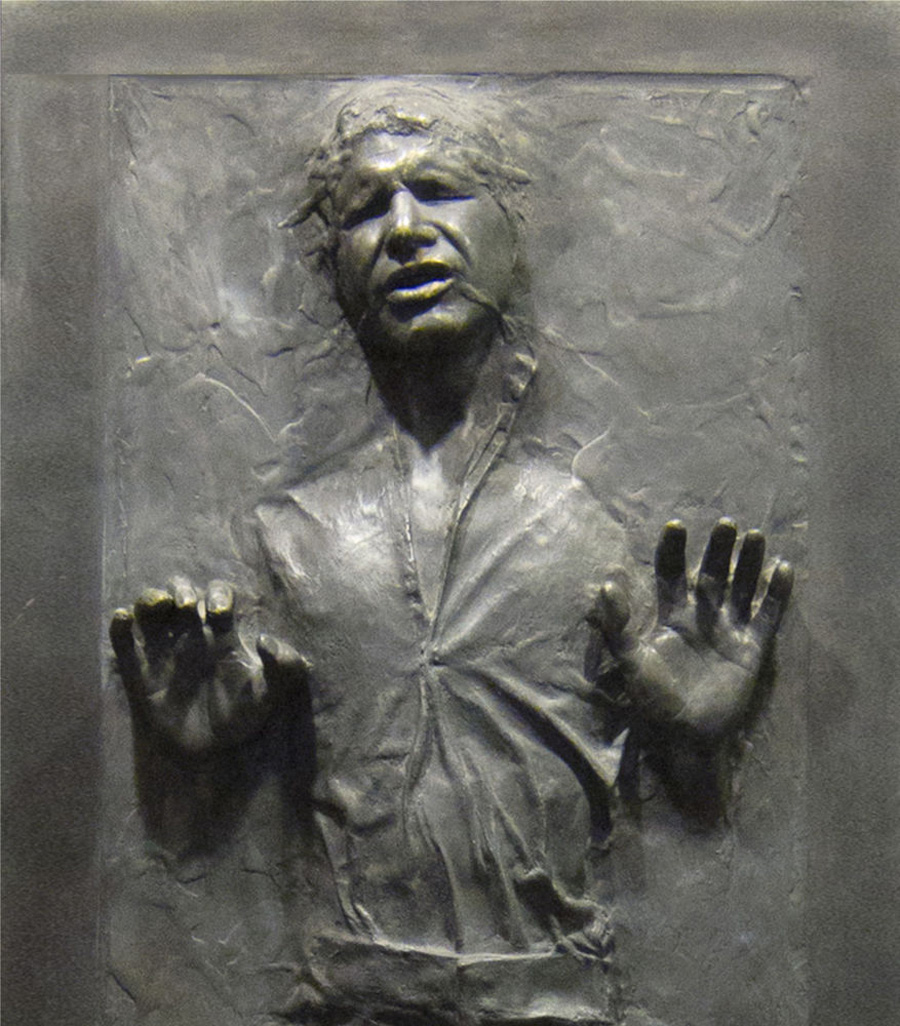
Han Solo frozen in carbonite, from Star Wars
 3. How did Han Solo freeze so quickly (and reversibly!) in carbonite? The bioheat equation  developed in Chapter 14 of IPMB implies that heat diffuses into tissue, and over long distances diffusion is slow. My guess is that carbonite freezing makes use of the blood flow term in the bioheat equation, perhaps by rapidly injecting cold carbonite intravenously. However, I don’t see any IV tubes coming out of Han. Do you? Carbonite freezing has to be dangerous. But no matter; had Han died during freezing, Chewbacca would have saved Princess Leia.

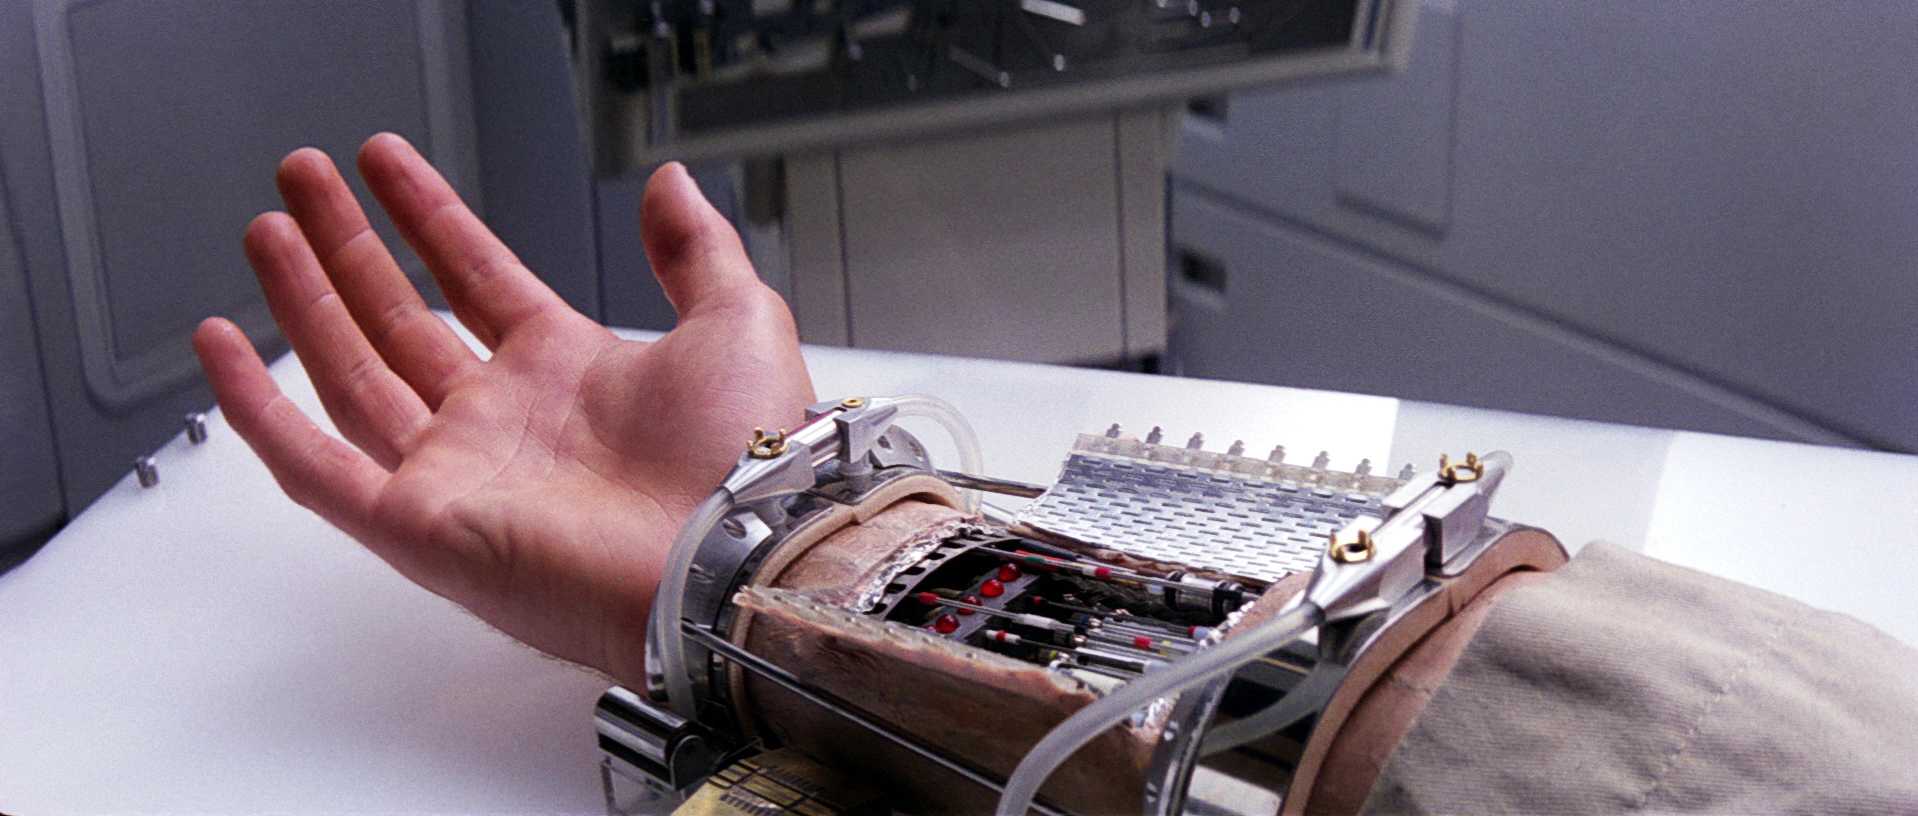
Luke Skywalker's robotic hand, from Star Wars.
4. How does Luke Skywalker’s artificial hand work? Chapter 7 of IPMB discusses electrical stimulation of nerves, which is crucial for developing neural prostheses. Luke had such a prosthesis after he lost his hand during his epic duel with Darth Vader (Luke’s FATHER!). Functional neural stimulation is becoming so sophisticated that artificial hands may arrive sooner than you think.


Darth Vadar, from Star Wars.
5. How does Darth Vader control his breathing? Chapter 10 in IPMB analyzes feedback loops, and our main example describes how we control the carbon dioxide in our blood by adjusting our ventilation rate. I wonder, does Vader’s mask break that feedback loop? Perhaps a carbon dioxide sensor in the mask adjusts the rate of his slow, heavy breathing. I suspect something is horribly wrong with his physiological control mechanism, because once the mask comes off Vader dies.


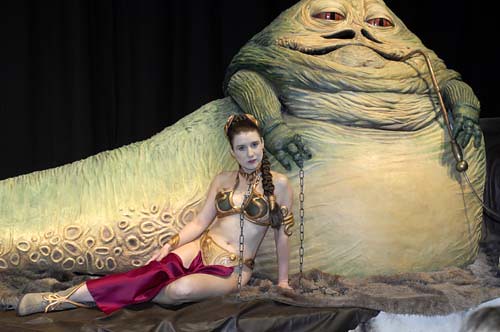
Jabba the Hut, from Star Wars.
6. What determines the anatomy of all those alien life forms? In Chapter 2 of IPMB, Russ and I describe how size impacts the structure of animals: scaling. One famous result involves the strength of bones. Body mass scales as length cubed, but the strength of a bone scales as its radius squared, meaning that bones must get thicker relative to their length in larger animals. This is why Jabba the Hutt has no legs. Yoda lied when he said “size matters not.”


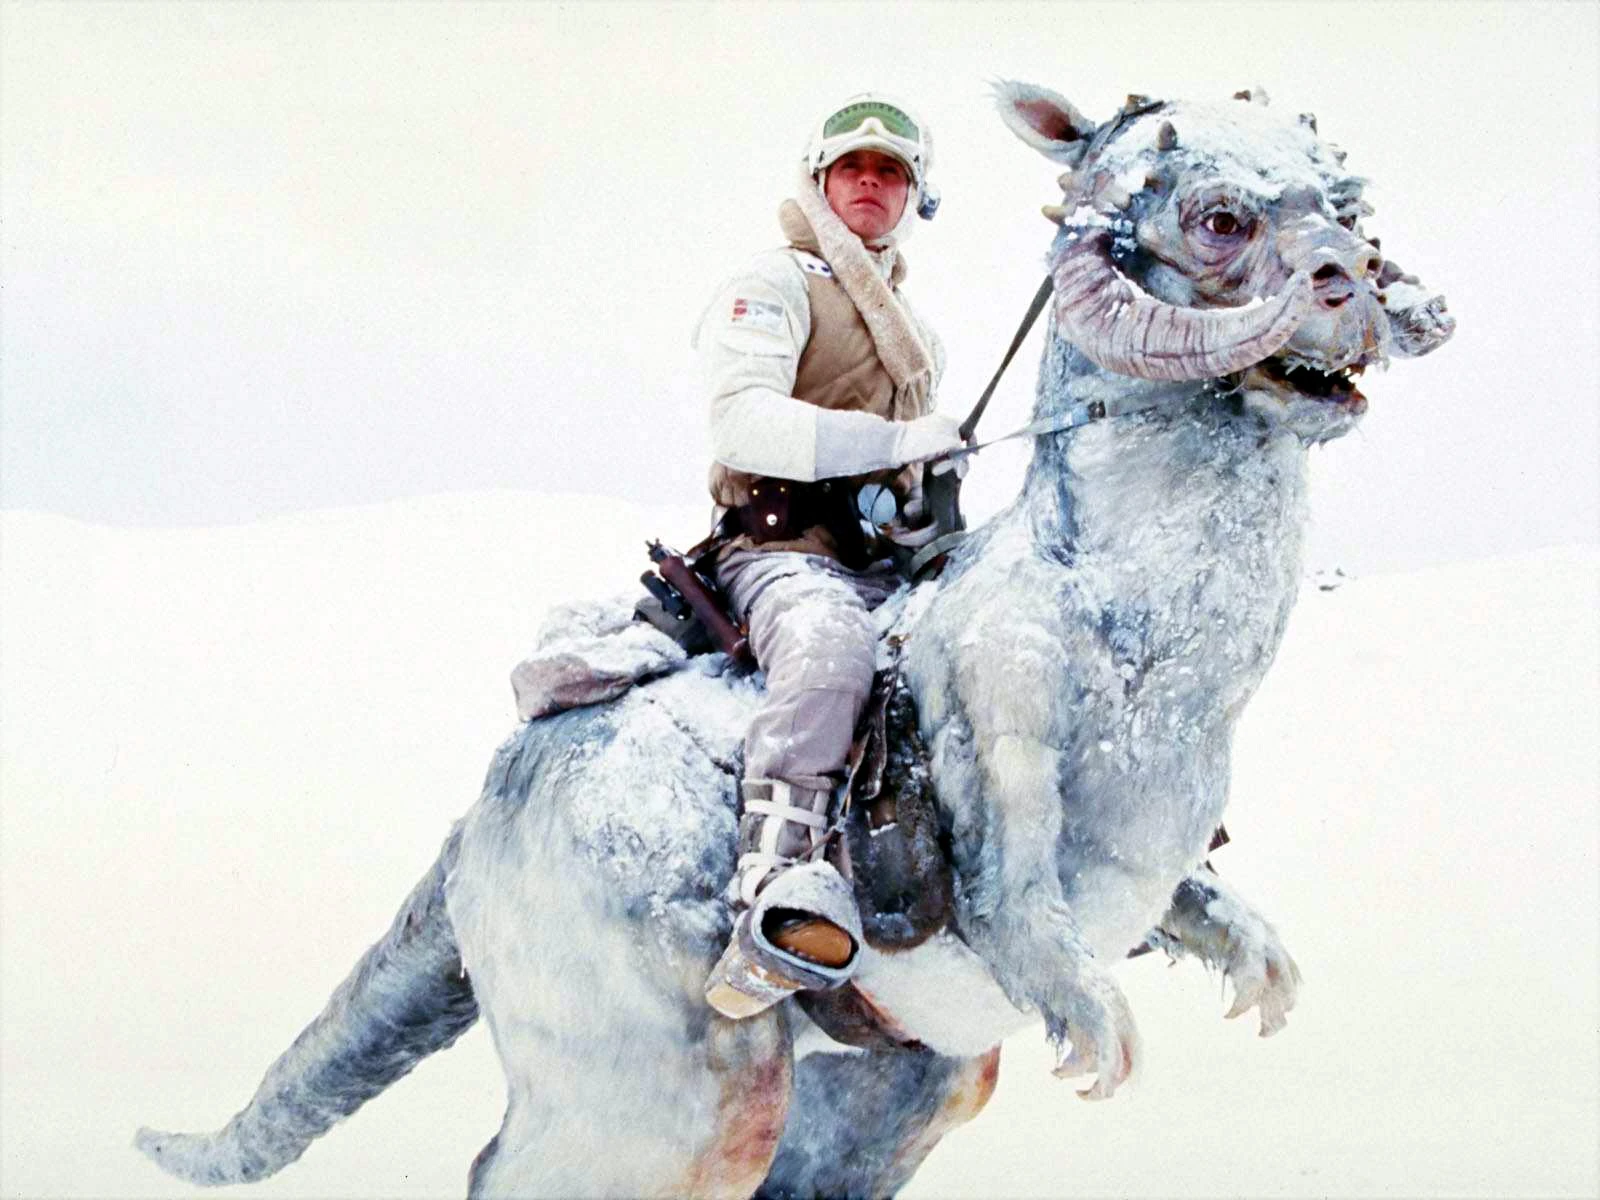
Luke Skywalker riding his tauntaun on Hoth, from Star Wars.
7. How did Luke avoid freezing to death on Hoth? When an animal dies, it loses heat according to Newton’s law of cooling (Chapter 3 in IPMB). After Han killed the tauntaun and shoved Luke into its belly, its temperature began to fall exponentially. Luke must have gotten really cold. What saved him was immersion into a bacta tank, which speeds rewarming by taking advantage of convection as well as conduction. I suspect bacta may also contain suspended stem cells, but who knows? Whatever the mechanism, Luke survived. During his recuperation is the most disturbing event in the entire Star Wars saga: the incestuous kiss. Ewwwwww!


Admiral Ackbar, from Star Wars.
8. What did leaders of the Rebel Alliance say when they realized that Vader knew about their plans to attack the Death Star? One way to measure radiation dose is to use thermoluminescent phosphors, which Russ and I describe in Chapter 16 of IPMB as a “dielectric material that has been doped with impurities or has missing atoms in the crystal lattice to form metastable energy levels or traps.” So, Admiral Ackbar must have just discovered the mechanism of thermoluminescence when he exclaimed “It’s a trap!” 


Jar Jar Binks, from Star Wars.
If you want answers to all of your Star Wars questions, keep a copy of Intermediate Physics for Medicine and Biology handy. Before watching the new film, find time for a Star Wars marathon (with episodes in machete order, thereby avoiding Jar Jar Binks). Finally, don’t miss my favorite version of the Star Wars theme song, performed in the video below by lounge singer Nick Winters. Now, off to the movies. And, May The Force Be With You.


Friday, December 11, 2015

The Art of Insight in Science and Engineering

The Art of Insight in Science and Engineering, by Sanjoy Mahajan, superimposed on Intermediate Physics for Medicine and Biology.
The Art of Insight
in Science and Engineering,
by Sanjoy Mahajan.
I recently read The Art of Insight in Science and Engineering, by Sanjoy Mahajan (MIT Press, 2014). The Preface begins:
Science and engineering, our modern ways of understanding and altering the world, are said to be about accuracy and precision. Yet we best master the complexity of our world by cultivating insight rather than precision.

We need insight because our minds are but a small part of the world. An insight unifies fragments of knowledge into a compact picture that fits in our minds. But precision can overflow our mental registers, washing away the understanding brought by insight. This book shows you how to build insight and understanding first, so that you do not drown in complexity.
I think that Mahajan makes a good point. I’ve noticed that many of my students can use complicated algorithms to calculate numbers correctly, but often lack the ability to estimate a solution. This leads students to make mistakes in their homework that result in ridiculously wrong results. When this happens, I often print “THINK BEFORE YOU CALCULATE” in big red letters on their paper, and take off more than my normal number of points. On the other hand, when a homework question requires an intricate calculation that the student skips but instead writes down a reasonable estimate for the solution, I take off a few points but give them most of the credit because they actually thought about what they were doing.

Russ Hobbie and I stress estimation in the very first section of Intermediate Physics for Medicine and Biology: “One valuable skill in physics is the ability to make order of-magnitude estimates, meaning to calculate something approximately right.”. We provide several “back-of-the-envelope” homework problems in our book, such as “Estimate the number of hemoglobin molecules in a red blood cell,” “Estimate the size of a box containing one air molecule”, and “Estimate the density of water”. In fact, if you search through our book for the word “estimate” you will find many such questions. Students often object to these problems. When I explore why they are having difficulty, I find that many are reluctant to guess some number. For instance, a homework problem in Chapter 6 says “Suppose that an action potential in a 1-μm diameter unmyelinated fiber has a speed of 1.3 m s−1. Estimate how long it takes a signal to propagate from the brain to a finger.” Some students grind to a halt because the length of the arm is not given (or they use 1 μm for the length, getting a ridiculous result). When I tell them that the word “estimate” means “make a reasonable guess,” they’re not any happier; they think that guessing the length of the arm is cheating. But I’m just asking them to estimate the time to send a signal from the brain to the hand, and then THINK about the result. That’s why the last sentence in the problem says “Speculate on the significance of these results for playing the piano.”

In The Art of Insight, Mahajan also talks about units. In homework assignments, I often ask my students to algebraically solve for some expression; for example a relationship involving a distance x, time t, and speed v. A student will sometimes hand in a result like “v + x t”. Yikes! The units don’t work! (I use a lot of exclamation points when grading assignments.) I am stingy with partial credit when the derived equation is dimensionally incorrect, not because I want to punish a minor error, but because the student didn’t take the time to look at their equation and ask “do the units make sense?”

Another skill Mahajan stresses is proportional reasoning. Russ and I emphasize this in Chapter 2, when we discuss scaling. For instance, here is a question from an exam I gave earlier this semester in my Biological Physics class:
Assume the specific metabolic rate R* scales with mass M as R* = C M1/4 , where C is a constant. If an 81 kg person has a specific metabolic rate of 1.5 W/kg, what is the specific metabolic rate of a 1 kg guinea pig?
Some students get stuck because I didn’t give them a value for C. The point is, R* times M1/4 is a constant, so R*person Mperson1/4 = R*guinea pig Mguinea pig1/4. You don’t need C. (You don't even need your calculator if you recall that 81 = 34.)

Mahajan talks about examining “easy cases,” which is similar to our emphasis on taking limits of equations. Consider the analysis of Eq. 2.25 in IPMB: dy/dt = a – by. The solution (Eq. 2.26) is y = a/b (1 – e−bt). When I derive this equation in class, I always stop and ask the students what is the limit when t goes to inifinity? The answer is clearly y = (a/b), which they usually get right. Then I ask what is the limit when t goes to zero? This case requires more thought. A student will often say “zero,” but then I respond “yes, but HOW does it go to zero?” Using the Taylor series ex = 1 + x gives a limit of y = at. This skill is even more important for more complicated expressions. For instance, Section 4.12 in IPMB compares drift and diffusion. Equation 4.63 gives the concentration of a material that drifts with fluid speed v and diffuses with diffusion constant D through a tube of length x1. The student gains much insight by taking the limits when x1v/D is much greater than one and much less than one. If the student doesn’t take these limits, then this example is just a mathematical exercise that provides no insight.

Finally, Mahajan discusses briefly the value of log-log plots when analyzing scaling laws. This is a topic Russ and I emphasize in Chapter 2 of IPMB. It’s amazing how much information you can get from a log-log plot. One little fact I never realized until I read Mahajan’s book is that the geometric mean, √ab, of two numbers a and b is just the half-way point between the two numbers on a logarithmic scale.

A Mind for Numbers: How to Excel at Math and Science (Even if You Flunked Algebra), by Barb Oakley, superimposed on Intermediate Physics for Medicine and Biology.
A Mind for Numbers,
by Barb Oakley.
I had a chance to offer my views on insight and learning when my Oakland University colleague and friend Barb Oakley published her book A Mind for Numbers: How to Excel at Math and Science (Even if You Flunked Algebra). Barb asked several people, including me, for short “sidebars” to include in her book. Here is mine:
Insights on Learning from Physics Professor Brad Roth, A Fellow of the American Physical Society and Co-Author of Intermediate Physics for Medicine and Biology

One thing I stress in my classes is to think before you calculate. I really hate the ‘plug and chug’ approach that many students use. Also, I find myself constantly reminding students that equations are NOT merely expressions you plug numbers into to get other numbers. Equations tell a story about how the physical world works. For me, the key to understanding an equation in physics is to see the underlying story. A qualitative understanding of an equation is more important than getting quantitatively correct numbers out of it.

Here are a few more tips:

1. Often, it takes way less time to check your work than to solve a problem. It is a pity to spend twenty minutes solving a problem and then get it wrong because you did not spend two minutes checking it.

2. Units of measurement are your friend. If the units don’t match on each side of an equation, your equation is not correct. You can’t add something with units of seconds to something with units of meters. It’s like adding apples and rocks—nothing edible comes of it. You can look back at your work, and if you find the place where the units stop matching, you probably will find your mistake. I have been asked to review research papers that are submitted to professional journals that contain similar errors.

3. You need to think about what the equations means, so that your math result and your intuition match. If they don’t match, then you have either a mistake in your math or a mistake in your intuition. Either way, you win by figuring out why the two don’t match.

4. (Somewhat more advanced) For a complicated expression, take limiting cases where one variable or another goes to zero or infinity, and see if that helps you understand what the equation is saying.
Books like The Art of Insight and A Mind for Numbers reinforce fundamental yet critical skills. I hope IPMB reinforces these skills too.

Friday, December 4, 2015

A Mathematical Model of Make and Break Electrical Stimulation of Cardiac Tissue by a Unipolar Anode or Cathode

The first page of A Mathematical Model of Make and Break Electrical Stimulation of Cardiac Tissue by a Unipolar Anode or Cathode (IEEE Transactions on Biomedical Engineering, 42:1174–1184. 1995).
“A Mathematical Model of Make and Break
Electrical Stimulation of Cardiac Tissue
by a Unipolar Anode or Cathode.”
Suppose I was going to die tomorrow and I could choose only one paper to cite on my tombstone. Which would I pick? I’d select
B. J. Roth, 1995, “A Mathematical Model of Make and Break Electrical Stimulation of Cardiac Tissue by a Unipolar Anode or Cathode,” IEEE Transactions on Biomedical Engineering, Volume 42, Pages 1174–1184.
Below is the introduction, with references removed. I like the way it starts with a question.
What is the mechanism by which an electrical current, passed through a unipolar electrode, excites cardiac tissue? This simple question appears to have a straightforward answer: The stimulus current depolarizes the tissue under the electrode until the transmembrane potential reaches threshold, triggering an action potential wave front. Excitation of cardiac tissue, however, is more complicated than one might initially expect. Stimulation with a cathode might be explained by depolarization of the tissue under the electrode, but how does one explain stimulation with an anode? Even more intriguing, excitation is elicited by turning a stimulus off (break) as well as by turning it on (make). Why should turning off the stimulus excite the tissue? Indeed, four distinct mechanisms are responsible for stimulation of cardiac tissue—cathode make, anode make, cathode break, and anode break—and only cathode-make stimulation can be explained by depolarization under the electrode. To understand the other three mechanisms, we make detailed calculations of the transmembrane potential distribution induced by current through a unipolar electrode. We have three goals: to explain the mechanisms of excitation qualitatively; to predict stimulation thresholds quantitatively; and to determine how the threshold varies with electrode size and with stimulus pulse duration and frequency.

Our calculations are based on the bidomain model of cardiac tissue, which is useful for predicting the transmembrane potential induced by an extracellularly applied electric field. The bidomain model is a two- or three-dimensional cable model that accounts for the resistance of both the intracellular and the extracellular spaces. Many of the most interesting and nonintuitive predictions of the bidomain model occur when the ratios of the electrical conductivities parallel to and perpendicular to the myocardial fibers in the intracellular and extracellular spaces differ. For instance, current that is passed through a point extracellular electrode into a two-dimensional bidomain with unequal anisotropy ratios induces adjacent areas of depolarization and hyperpolarization. Such a region of hyperpolarization near a cathode is called a virtual anode; a region of depolarization near an anode is called a virtual cathode. The existence of virtual anodes and cathodes is predicted by the bidomain model and is essential for three of the four mechanisms of stimulation. Recently, virtual anodes and cathodes were observed experimentally in cardiac tissue.
My use of the royal “we” seemed reasonable when I wrote the paper, but now it grates on my ear. According to Google Scholar, in the twenty years since I published this article it has been cited 169 times. In Intermediate Physics for Medicine and Biology, Russ Hobbie and I turned the prediction of break excitation of cardiac tissue into a homework problem (Chapter 7, Problem 48).

I did this research while working at the National Institutes of Health in Bethesda, Maryland. Sometimes on a slow afternoon I would sneak away from my desk and browse the stacks of the NIH library. One day I found a fascinating paper by Egbart Dekker, who measured the threshold for each of the four mechanisms of excitation (E. Dekker, 1970, “Direct Current Make and Break Thresholds for Pacemaker Electrodes on the Canine Ventricle,” Circulation Research, Volume 27, Pages 811–823.) Once I read Dekker’s article, I knew I could simulate this behavior using the then-new bidomain model and perhaps gain insight about mechanisms. At the time I was not well versed in mathematical models of the cardiac membrane kinetics with all their different ion currents, so I just used the Hodgkin-Huxley model of a nerve axon. A paper describing that study was unpublishable because who in their right mind would use a squid nerve axon model to represent a cardiac action potential? After the manuscript using the Hodgkin-Huxley model was rejected, I set to work learning about cardiac ion channel dynamics. I chose the Beeler-Reuter model, and the paper using the BR model (no, I did not choose that model because of my initials) was ultimately accepted for publication.

I sent a draft of my article to my PhD advisor, John Wikswo. He and his post doc Marc Lin immediately verified the model predictions experimentally (see their lovely paper: J. P. Wikswo, S. F. Lin, and R. A. Abbas, 1995, “Virtual Electrodes in Cardiac Tissue: A Common Mechanism for Anodal and Cathodal Stimulation,” Biophysical Journal, Volume 69, Pages 2195–2210). I remember the day Wikswo emailed me asking something like “what would you say if I told you the cathode make, cathode break, and anode make mechanisms all behave exactly as you predicted, but your anode break mechanism is totally wrong?” I began to panic, wondering how in the world I messed up, and sent Wikswo a frantic email asking for more details. His response was along the lines of “I asked ‘what would you say?’ I didn’t claim your prediction was actually wrong.” Ha, ha, ha; all four mechanisms were verified. Their paper was published the same month as mine and now has 300 citations. Your can read a layman’s account of this work in an article published in the Vanderbilt Register.

The figures in my original article were all black-and-white contour plots of action potential wave fronts propagating through the tissue. Wikswo had beautiful color figures in his paper. So, a few years later I “colorized” the figures, including them in a review article (B. J. Roth, S.-F. Lin and J. P. Wikswo, Jr., 1998, “Unipolar Stimulation of Cardiac Tissue,” Journal of Electrocardiology, Volume 31, Supplement, Pages 6–12). This always reminds me of how some of the classic old black-and-white movies have been colorized to look modern.

One reason I like publishing in the IEEE TBME is that they provide a short biographical sketch of the author. Below is my bio from 20 years ago. My how time flies.
Bradley J. Roth was raised in Morrison, Illinois. He received the B.S. degree from the University of Kansas in 1982, where he was a Summerfield Scholar and received the Stranathan Award from the Department of Physics and Astronomy. He received the Ph.D. degree in physics from Vanderbilt University.

From 1988-1995, he worked in the Biomedical Engineering and Instrumentation Program at the National Institutes of Health. One of his primary accomplishments while at NIH was the study of the bidomain model and its application to solving fundamental problems solving the interaction of applied electric fields with cardiac muscle. Using the results of numerical simulations, he has formulated mechanisms for stimulation, defibrillation, and the initiation of arrhythmias in the heart In September, 1995, he became the Robert T. Lagemann Assistant Professor of Living State Physics at Vanderbilt University.

Friday, November 27, 2015

Steven Vogel (1940-2015)

Life in Moving Fluids,  by Steven Vogel, superimposed on Intermediate Physics for Medicine and Biology.
Life in Moving Fluids,
by Steven Vogel.
Steven Vogel died on Tuesday. He was the author of several excellent books about the interface between physics and biology. Two that Russ Hobbie and I cite in the first chapter of Intermediate Physics for Medicine and Biology are Vital Circuits (1992) and Life in Moving Fluids (1994), which is one of the books featured in the IPMB Ideal Bookshelf. I posted two blog entries about Vogel’s book Glimpses of Creatures in Their Physical Worlds, here and here. I quote him extensively in a blog entry about the Law of Laplace, in a blog entry about Murray’s law, and in a blog entry about the Reynolds number. His other books I have enjoyed include Life’s Devices, Cats’ Paws and Catapults, and Prime Mover. Reading The Life of a Leaf remains on my to-do list.

I learned the sad news of Vogel’s death from Raghuveer Parthasarathy’s blog The Eighteenth Elephant. There is little I can add to his eloquent tribute. I attended the same conference that Parthasarathy writes about, which is where I met Vogel. He was a delightful and fascinating man. You can listen to him talk about writing scientific papers here, and read his obituary here.

 Steven Vogel talking about writing scientific papers.

I leave you with Vogel’s own words, the first two paragraphs of the Preface from the second edition of Life in Moving Fluids. I don’t own the first edition, but I will try to hunt down for you the “first punning sentence” of the first edition Preface that Vogel refers to. I always love a good pun.
About a dozen years ago, calling up a degree of hubris I now find quite inexplicable, I wrote a book about the interface between biology and fluid dynamics. I had never deliberately written a book, and I had never taken a proper course in fluids. But I had learned through teaching—both something about the subject and something about the dearth of material that might provide a useful avenue of approach for biologist and engineer. Each seemed dazzled and dismayed by the complexity of the other’s domain. The book happened in a hurry, in a kind of race against the impending end of a sabbatical semester, and in a kind of mad fit of passion driven by simple realization (and astonishment) that it was actually happening.
The reception of Life in Moving Fluids turned out to surpass my most self-indulgent fantasies—it reached the people I hoped to reach, from ecologist and marine biologist to physical and applied scientists of various persuasions, and it seems to have played a catalytic or instigational role in quite a few instances. Quite clearly the book has been the most important thing of a professional sort that I’ve ever done: certainly that’s true if measured by the frequency with which the first punning sentence of its preface is flung back at me (That my writing has been more important than my research in furthering my area of science suggests that doing hands-on science, which I enjoy, is really just a personal indulgence—quite a curious state of affairs!)
Note added a few hours after the post: Russ has the first edition. He says the first line of the preface is “Fluid flow is not currently in the mainstream of biology, but it has its place.”

Friday, November 20, 2015

The Mystery of the Flawed Homework Problem

When teaching PHY 325 (Biological Physics) this fall, I assigned my students homework from the 5th edition of Intermediate Physics for Medicine and Biology. One problem comes from Section 7.10 about Electrical Stimulation.
Problem 36. If the medium has a constant resistance, find the energy required for stimulation as a function of pulse duration.
The odd thing is, when I looked in the solution manual to review how to solve this problem, it contained answers to parts (a) and (b), and (b) is the most useful part. Where are (a) and (b)? Somehow when preparing the 5th edition, part (b) was left out (it is missing from the 4th edition too). Nevertheless, part (b) ended up in the solution manual (don’t ask me how). This is what Problem 36 should look like:
Problem 36. The longevity of a pacemaker battery is related to the energy required for stimulation.
(a) Find an expression for the energy U expended by a pacemaker to stimulate the heart as a function of the pulse duration t. Use the Lapicque strength-duration curve (Eq. 7.45), and assume the body and electrodes have a constant resistance R. Sketch a plot of energy versus duration.
(b) In general you want to stimulate using the least energy. Determine what duration minimizes the energy expended per pulse.
I don’t usually solve homework problems from the book in this blog, but because the interesting part of this problem was left out of IPMB I don’t think it will hurt in this case. Also, it provides readers with a sneak peak at the solution manual. Remember that Russ Hobbie and I will only send the solution manual to instructors, not students. So if you are teaching from IPMB and want the solution manual, by all means contact us. If you are a student, however, you had better talk to your instructor.
7.36 Issues such as pacemaker battery life are related to the energy required for electrical stimulation. This problem relates the energy to the strength-duration curve, and provides additional insight into the physical significance of the chronaxie.
(a) Let the resistance seen by the electrode due to the medium be R. The power is i2R. Therefore the total energy is
An equation giving the energy of a stimulation pulse.
 (b) The duration corresponding to minimum energy is found by setting dU/dt = 0. We get
An equation specifying the minimum energy of a stimulation pulse.
which reduces to t = tC. The minimum energy corresponds to a duration equal to the chronaxie.
In the 5th edition’s solution manual, each problem has a brief preamble (in italics) explaining the topic and describing what the student is supposed to learn. We also mark problems that are higher difficulty (*), that complete a derivation from the text (§), and that are new in the fifth edition (¶). Problem 7.36 didn’t fall into any of these categories. We typically outline the solution, but don’t always show all the intermediate steps. I hope we include enough of the solution that the reader or instructor can easily fill in anything missing.

One thing not in the solution manual is the plot of energy, U, versus duration, t. Below I include such a plot. The energy depends on the rheobase current iR, the chronaxie tC, and the resistance R.

The energy of a stimulus pulse as a function of pulse duration.
I wonder if this change to Problem 7.36 should go into the IPMB errata? It is not really an error, but more of an omission. After some thought, I have decided to include it, since it was supposed to be there originally. You can find the errata at the book's website: https://sites.google.com/view/hobbieroth. I urge you to download it and mark the corrections in your copy of IPMB.

I hope this blog post has cleared up the mystery behind Problem 7.36. Yet, the curious reader may have one last question: why did I assign a homework problem to my students that is obviously flawed? The truth is, I chose which homework problems to assign by browsing through the solution manual rather than the book (yes, the solution manual is that useful). Problem 7.36 sure looked like a good one based on the solution manual!

Friday, November 13, 2015

Stokes' Flow around a Sphere

When working on the 5th edition of Intermediate Physics for Medicine and Biology, Russ Hobbie and I added a new homework problem about low Reynolds number flow. We ask the reader to analyze the classic example of “Stokes’ flow” or “creeping flow” around a sphere.
Problem 46. Consider a stationary sphere of radius a placed in a fluid of viscosity η moving uniformly with speed V. For low Reynolds number flow, the radial and tangential components of the fluid velocity and the pressure surrounding the sphere are
Equations giving the velocity and pressure around a sphere during Stokes' flow.
(a) Show that the no-slip boundary condition is satisfied.
(b) Integrate the shear force and the pressure force over the sphere surface and find an expression for the net drag force on the sphere (Stoke’s law). What fraction of this force arises from pressure drag, and what fraction from viscous drag?
(Everywhere else in our book we correctly write “Stokes’ law” since the law is named after Sir George Stokes, but in this problem we slip up and write “Stoke’s law”. Sorry. I noted this in the errata available on the book website.)

After solving this problem, the reader is probably thinking “this is all well and nice, and I understand now how you get Stokes’ law from the pressure distribution and the viscous drag, but where in the world did you get those weird velocity and pressure distributions?”

First, this example applies to a sphere in water, and water is nearly incompressible. Problem 1.35 shows that incompressibility implies that the velocity u has zero divergence,
An equation indicating that the divergence of the velocity is zero, the condition for incompressibility.
The reader should pause now, look up the expression for the divergence in spherical coordinates, and verify that the given velocity really is divergenceless.

Second, the equation describing flow is the Navier-Stokes equation, which is really nothing more than Newton’s second law (F=ma) applied to the fluid. Problem 1.28 provides some insight by deriving a simplified form of the Navier-Stokes equation
A one dimensional version of the Navier-Stokes equation for fluid flow. 
If we assume a low Reynolds number, we can ignore the two terms on the left-hand side of this equation because they are “inertial” terms arising from the acceleration of the fluid. The two terms on the right-hand side can be generalized to three dimensions, with the pressure term containing the gradient of the pressure and the viscous term containing the Laplacian of the velocity. The resulting Navier-Stokes equation is
The Navier-Stokes equation for low Reynolds number flow.
To get the expressions given in the new Problem 1.46, solve the Navier-Stokes equation assuming an incompressible fluid. In addition, the boundary conditions are 1) far from the sphere (r much greater than a) the flow is entirely along the z-axis with speed V, and 2) at the sphere surface (r = a) the radial component of the velocity vanishes because the flow is incompressible and the tangential component of the velocity vanishes because of the no-slip boundary condition.

Stokes’ law for the net drag force F, derived in part (b) of Problem 1.46, is F = 6πηaV. Often the drag force is described by a dimensionless coefficient called the drag coefficient, C, equal to F divided by ½ρV2πa2. For creeping flow around a sphere, the drag coefficient is
An equation giving the drag coefficient during low Reynolds number flow around a sphere.
Using the definition of the dimensionless Reynolds number, Re (Eq. 1.62 in IPMB), we find that C = 12/Re. Often the Reynolds number is written in terms of the diameter of the sphere rather than the radius, in which case we get the more commonly quoted relationship C = 24/Re. In many fluid dynamics textbooks you will see C plotted versus Re (usually on log-log graph paper). At low Reynolds number C is inversely proportional to Re as creeping flow predicts. At high Reynolds number the relationship between C and Re is more complex because a turbulent boundary layer forms near the sphere surface. But that’s another story.

Friday, November 6, 2015

The Magnetic Field of a Single Axon (Part 2)

In my last blog entry, I began the story behind “The Magnetic Field of a Single Axon: A Comparison of Theory and Experiment” (Biophysical Journal, Volume 48, Pages 93–109, 1985). I wrote this paper as a graduate student working for John Wikswo at Vanderbilt University. (I use the first person “I” in this blog post because I was usually alone in a windowless basement lab when doing the experiment, but of course Wikswo taught me how to do everything including how to write a scientific paper.) Last week I described how I measured the transmembrane potential of a crayfish axon, and this week I explain how I measured its magnetic field.

A toroid used to measure the magnetic field of a single axon.
A toroid used to measure
the magnetic field of a single axon.
The magnetic field was recorded using a wire-wound toroid (I have talked about winding toroids previously in this blog). Wikswo had obtained several ferrite toroidal cores of various sizes, most a few millimeters in diameter. I wound 50 to 100 turns of 40-gauge magnet wire onto the core using a dissecting microscope and a clever device designed by Wikswo to rotate the core around several axes while holding its location fixed. I had to be careful because a kink in a wire having a diameter of less than 0.1 mm would break it. Many times after successfully winding, say, 30 turns the wire would snap and I would have to start over. After finishing the winding, I would carefully solder the ends of the wire to a coaxial cable and “pot” the whole thing in epoxy. Wikswo—who excels at building widgets of all kinds—had designed Teflon molds to guide the epoxy. I would machine the Teflon to the size we needed using a mill in the student shop. (With all the concerns about liability and lawsuits these days student shops are now uncommon, but I found it enjoyable, educational, and essential.) Next I would carefully place the wire-wound core in the mold with a Teflon tube down its center to prevent the epoxy from sealing the hole in the middle. This entire mold/core/wire/cable would then be placed under vacuum (to prevent bubbles), and filled with epoxy. Once the epoxy hardened and I removed the mold, I had a “toroid”: an instrument for detecting action currents in a nerve. In 1984, this “neuromagnetic current probe” earned Wikswo an IR-100 award. The basics of this measurement are described in Chapter 8 of Intermediate Physics for Medicine and Biology.

In Wikswo’s original experiment to measure the magnetic field of a frog sciatic nerve (the entire nerve; not just a single axon), the toroid signal was recorded using a SQUID magnetometer (see Wikswo, Barach, Freeman, “Magnetic Field of a Nerve Impulse: First Measurements,” Science, Volume 208, Pages 53–55, 1980). By the time I arrived at Vanderbilt, Wikswo and his collaborators had developed a low-noise, low-input impedance amplifier—basically a current-to-voltage converter—that was sensitive enough to record the magnetic signal (Wikswo, Samson, Giffard, “A Low-Noise Low Input Impedance Amplifier for Magnetic Measurements of Nerve Action Currents,” IEEE Trans. Biomed. Eng. Volume 30, Pages 215–221, 1983). Pat Henry, then an instrument specialist in the lab, ran a cottage industry building and improving these amplifiers.

To calibrate the instrument, I threaded the toroid with a single turn of wire connected to a current source that output a square pulse of known amplitude and duration (typically 1 μA and 1 ms). The toroid response was not square because we sensed the rate-of-change of the magnetic field (Faraday’s law), and because of the resistor-inductor time constant of the toroid. Therefore, we had to adjust the signal using “frequency compensation”; integrating the signal until it had the correct square shape.

The amplifier output was recorded by a digital oscilloscope that saved the data to a tape drive. Another of my first jobs at Vanderbilt was to write a computer program that would read the data from the tape and convert it to a format that we could use for signal analysis. We wrote our own signal processing program—called OSCOPE, somewhat analogous to MATLAB—that we used to analyze and plot the data. I spent many hours writing subroutines (in FORTRAN) for OSCOPE so we could calculate the magnetic field from the transmembrane potential, and vice versa.

A drawing of the experiment to measure the transmembrane potential, the extracellular potential, and the magnetic field of a single axon.
An experiment to measure the
transmembrane potential, the extracellular potential,
and the magnetic field of a single axon.
Once all the instrumentation was ready, the experiment itself was straightforward. I would dissect the ventral nerve cord from a crayfish and place it in a plexiglass bath (again, machined in the student shop) filled with saline (or more correctly, a version of saline for the crayfish called van Harreveld’s solution). The nerve was gently threaded through the toroid, a microelectrode was poked into the axon, and an electrode to record the extracellular potential was placed nearby. I would then stimulate the end of the nerve. It was easy to excite just a single axon; the nerve cord split to go around the esophagus, so I could place the stimulating electrode there and stimulate either the left or right half. In addition, the threshold of the giant axon was lower than that of the many small axons, so I could adjust the stimulator strength to get just one giant axon.

The magnetic field of a single axon. The data was recorded with no averaging.
The magnetic field of a single axon.
When I first started doing these experiments, I had a horrible time stimulating the nerve. I assumed I was either crushing or stretching it during the dissection, or there was something wrong with the saline solution, or the epoxy was toxic. But after weeks of checking every possible problem, I discovered that the coaxial cable leading to the stimulating electrode was broken! The experiment had been ready to go all along; I just wasn’t stimulating the nerve. Frankly, I now believe it was a blessing to have a stupid little problem early in the experiment that forced me to check every step of the process, eliminating many potential sources of trouble and giving me a deeper understanding of all the details. 

As you can tell, a lot of effort went into this experiment. Many things could, and did, go wrong. But the work was successful in the end, and the paper describing it remains one of my favorites. I learned much doing this experiment, but probably the most important thing I learned was perseverance.

Friday, October 30, 2015

The Magnetic Field of a Single Axon (Part 1)

The Magnetic Field of a Single Axon: A Comparison of Theory and Experiment (Biophysical Journal, 48:93–109, 1985)..
“The Magnetic Field of a Single Axon.”
Thirty years ago, John Wikswo and I published “The Magnetic Field of a Single Axon: A Comparison of Theory and Experiment” (Biophysical Journal, Volume 48, Pages 93–109, 1985). This was my second journal article (and my first as first author). Russ Hobbie and I cite it in Chapter 8 of the 5th edition of Intermediate Physics for Medicine and Biology. I reproduce the introduction below.
An active nerve axon can be modeled with sufficient accuracy to allow a detailed calculation of the associated magnetic field. Therefore the single axon provides a simple, yet fundamentally important system from which we can test our understanding of the relation between biomagnetic and bioelectric fields. The magnetic field produced by a propagating action potential has been calculated from the transmembrane action potential using the volume conductor model (1). The purpose of this paper is to verify that calculation experimentally. To make an accurate comparison between theory and experiment, we must be careful to correct for all systematic errors present in the data.

To test the volume conductor model it is necessary to measure the transmembrane potential and magnetic field simultaneously. An experiment performed by Wikswo et al. (2) provided preliminary data from a lobster axon, however the electric and magnetic signals were recorded at different positions along the axon and no quantitative comparisons were made between theory and experiment. In the experiment reported here, these limitations were overcome and improved instrumentation was used (3–5).
As the introduction notes, the volume conductor model was described in reference (1), which is an article by Jim Woosley, Wikswo and myself (“The Magnetic Field of a Single Axon: A Volume Conductor Model,” Mathematical Biosciences, Volume 76, Pages 1–36, 1985). I have discussed the calculation of the magnetic field previously in this blog, so today I’ll restrict myself to the experiment.

I was not the first to measure the magnetic field of a single axon. Wikswo’s student, J. C. Palmer, had made preliminary measurements using a lobster axon; reference (2) is to their earlier paper. One of the first tasks Wikswo gave me as a new graduate student was to reproduce and improve Palmer’s experiment, which meant I had to learn how to dissect and isolate a nerve. Lobsters were too expensive for me to practice with so I first dissected cheaper crayfish nerves; our plan was that once I had gotten good at crayfish we would switch to the larger lobster. I eventually became skilled enough in working with the crayfish nerve, and the data we obtained was good enough, that we never bothered with the lobsters.

I had to learn several techniques before I could perform the experiment. I recorded the transmembrane potential using a glass microelectrode. The electrode is made starting with a glass tube, about 1 mm in diameter. We had a commercial microelectrode puller, but it was an old design and had poor control over timing. So, one of my jobs was to design the timing circuitry (see here for more details). The glass would be warmed by a small wire heating element (much like you have in a toaster, but smaller), and once the glass was soft the machine would pull the two ends of the tube apart. The hot glass stretched and eventually broke, providing two glass tubes with long, tapering tips with a hole at the narrow end of about 1 micron diameter. I would then backfill these tubes with 2 Molar potassium citrate. The concentration was so high that when I occasionally forgot to clean up after an experiment I would comeback the next day and find the water had evaporated leaving impressive, large crystals. The back end of the glass tube would be put into a plexiglass holder that connected the conducting fluid to a silver-chloride electrode, and then to an amplifier.

One limitation of these measurements was the capacitance between the microelectrode and the perfusing bath. Because the magnetic measurements required that the nerve be completely immersed in saline, I could not reduce the stray capacitance by lowering the height of the bath. This capacitance severely reduced the rate of rise of the action potential, and to correct for it we used “negative capacitance.” We applied a square voltage pulse to the bath, and measured the microelectrode signal. We then adjusted the frequency compensation knob on the amplifier (basically, a differentiator) until the resulting microelectrode signal was a square pulse. That was the setting we used for measuring the action potential. Whenever I changed the position of the electrode or the depth of the bath, I had to recalibrate the negative capacitance.

To record the transmembrane potential, I would poke the axon (easy to see under a dissecting microscope) with a microelectrode. Often the tip of the electrode would not enter the axon, so I would tap on the lab bench creating a vibration that was just sufficient to drive the electrode through the membrane. Usually I had the output of the microelectrode amplifier go to a device that output current with a frequency that varied with the microelectrode voltage. I’d put this current through a speaker, so I could listen for when the microelectrode tip was successfully inside the axon because the DC potential would drop by about 70 mV (the axon’s resting potential) and therefore the pitch of the speaker would suddenly drop.

Next week I will continue this story, describing how we measured the magnetic field.

The transmembrane potential, measured with a glass microelectrode from a single axon.
The measured transmembrane potential.

Friday, October 23, 2015

Clearance and Semilog Plots

I occasionally like to write a new homework problem as a gift to the readers of Intermediate Physics for Medicine and Biology. Here is the latest, for Section 2.5 about clearance.
Problem 11 ½. A patient has been taking the drug digoxin for her atrial fibrillation. Her distribution volume is V = 400 l. At time t = 0 she stops taking the drug and her doctor measures her blood digoxin concentration, C, every 24 hours.

t (hr) C (ng/ml)
0 0.85
24 0.53
48 0.33
72 0.20
96 0.125
120 0.077

Calculate the clearance, K, in ml/min.
I like this problem because it reinforces two concepts at once: 1) clearance, and 2) using semilog plots. First, let’s analyze clearance. Equation 2.21 in IPMB gives the blood concentration as a function of time

C(t) = Co exp(−(K/V)t) .

If we can measure the rate of decay of the concentration, b, where the exponential factor is written as exp(−bt), we can calculate the clearance from K = bV. So, this problem really is about estimating b from the given data.

To calculate the rate b, we should plot the data on semilog graph paper. You can download this graph paper (for free!) at http://www.printablepaper.net/category/log, http://customgraph.com, or http://www.intmath.com/downloads/graph-paper.php. The figure below shows the data points (dots).

A plot of the concentration as a function of time. In this semilog plot, the decay appears as a straight line.
The concentration as a function of time.

Now, draw a line through the dots. Sophisticated mathematical techniques could be used to fit the best line through this data, but for this homework problem I suggest merely fitting a line by eye. For data with no noise, such as used here, you should be able to calculate b to within a few percent using a ruler, pen, and some care.

Next, our goal is to determine the decay constant b from the equation C = Co exp(−bt) using the method discussed in Section 2.3. Select two points on the line. They could be any two, but I suggest two widely spaced points. I’ll use the initial data point (t = 0, C = 0.85) and then estimate the time when the line has fallen by a factor of ten (C = 0.085). The vertical dashed line in the above figure indicates this time, which I estimate to be t = 115 ± 2 hr. I include the uncertainty, which reflects my opinion that I can estimate the time when the dashed line hits the time axis to slightly better than plus or minus one half of one of the small divisions shown on the paper, each of which is 24/5 = 4.8 hr wide. So I have two equations: 0.85 = Co and 0.085 = Co exp(−115b). When I divide the two equations, Co cancels out and I find 10 = exp(115b). Therefore, b = ln(10)/115 = 0.0200 ± 0.0003 hr−1. If I write the exponential as exp(−t/τ), then the time constant is τ = 1/b = 50.0 ± 0.9 hr. Often we say instead that the half-life is t1/2 = ln(2) τ = 34.7 ± 0.6 hr.

At this point, I suggest you inspect the plot and see if your result makes sense. Does the line appear to drop by half in one half-life? Using the plot, at t = 35 hr I estimate that C is about 0.42, which is just about half of 0.85, so it looks like I’m pretty close.

Now we can get the clearance from K = bV = (0.02 hr−1)(400 l) = 8 l/hr. The problem asks for units of ml/min (a common unit used in the medical literature), so (8 l/hr)(1 hr/60 min)(1000 ml/l) = 133 ml/min. The uncertainty in the clearance is probably determined by the uncertainty in the distribution volume, which we are not given but I’d guess is known to an accuracy of no better than 10%.

Astute readers might be thinking “This is a great homework problem, but I don’t understand why the distribution volume is so big; 400 l is much more than the volume of a person!” The distribution volume does not represent an actual volume of blood or of body fluid. Rather, it takes into account that most of the digoxin is stored in the tissue, with relatively little circulating in the blood. But since the blood concentration is what we measure, the distribution volume must be “inflated” to account for all the drug stored in muscle and other tissues. This is a common trick in pharmacokinetics.

I believe that analyzing data with semilog or log-log graph paper is one of those crucial skills that must be mastered by all science students. As an instructor, you cannot stress it enough. Hopefully this homework problem, and ones like it that you can invent, will reinforce this technique.

Friday, October 16, 2015

The Lewis Number

Last week in this blog I discussed why dolphins don’t breathe through gills like fish do. The take-home message was that using gills would cool the blood to the temperature of the surrounding water, and reheating the blood to the temperature of the dolphin’s body would require a prohibitive amount of energy.

You might be wondering: is there some tricky way that we can adjust things so that oxygen can diffuse without a significant heat transfer? Perhaps alter how long the blood is in thermal and diffusive contact with the seawater so there is time for oxygen diffusion but not time for thermal diffusion. Might that save the day?

You can compare the mechanisms of molecular and thermal heat transfer using the Lewis number, which is a ratio of the molecular diffusion constant and the thermal diffusion constant. Russ Hobbie and I discuss the Lewis number in Problem 20 of Chapter 4 of Intermediate Physics for Medicine and Biology. For oxygen diffusing in water, the diffusion constant is about 2 x 10⁻⁹ m2/s. The diffusion constant for heat is equal to the thermal conductivity divided by the product of the specific heat capacity and the density, which for water is about 1.5 x 10⁻⁷ m2/s. Thus, the diffusion constant for oxygen is about one hundred times less than the diffusion constant for heat. In other words, heat diffuses one hundred times more readily than oxygen, so it’s difficult to imagine how you could ever devise a situation where you could transfer oxygen without transferring heat too. As we concluded last week, physics constrains biology.

If you are exchanging heat and oxygen in air the situation is a bit better: for air the diffusion constant of oxygen and of heat are roughly the same. You can’t have oxygen diffusion without heat diffusion, but at least you aren’t down by a factor of one hundred.

The Lewis number is one of those useful dimensionless numbers—like the Reynolds number and the Peclet number—that summarizes the relative importance of two physical mechanisms. Because these numbers are dimensionless, their values does not depend on the system of units you use.

This all sounds fine and good, so imagine my surprise when one of my Biological Physics students working on this week’s homework assignment told me that the definition of the Lewis number in IPMB differs from the definition used by other sources. Yikes! The question comes down to this: is the Lewis number defined as the molecular diffusion constant over the thermal diffusion constant, or as the thermal diffusion constant over the molecular diffusion constant? In one sense it does not matter which definition you use. Either definition will tell you that in water oxygen has a harder time diffusing than heat. The only difference is that in one case the Lewis number is 1/100, and in the other case it is 100. The definition is arbitrary, like which direction you call right and which you call left. Had the first person to talk about those two directions called right left and left right, it would make no difference; they are just labels. However, I concede that if everyone uses different labels, confusion results. If half the people call left left and the other half call left right, then giving directions will be difficult—you would have to verify that you used the same definition of left and right before you could tell someone how to get across town.

I decided to check that fount of all knowledge: Wikipedia (how did I grow up without it?). There the definition is the opposite of that in IPMB—“Lewis number (Le) is a dimensionless number defined as the ratio of thermal diffusivity to mass diffusivity.” The free dictionary says “A dimensionless number used in studies of combined heat and mass transfer, equal to the thermal diffusivity divided by the diffusion coefficient” and thermopedia says the same, as does this publication. In the book Air and Water, Mark Denny uses our definition, molecules over heat (perhaps I should say we use Denny’s definition, because I am pretty sure we used Air and Water as our source). Interestingly, the CRC Handbook of Chemistry and Physics (I looked at the 59th edition, which is the one sitting in my office) says heat over molecules, but then adds “N.B.: Lewis number is sometimes defined as reciprocal of this quantity”). My conclusion is that the definition is a bit uncertain, but Russ and I (and Denny) appear to have adopted the minority view. What should I do? I’ve added to the IPMB errata the following entry:
Page 109: At the end of Problem 20, add the sentence “Warning: the Lewis number is sometimes defined as the reciprocal of the definition used here.”