Monday, March 23, 2020

Practice Problems in Bioelectricity and Biomagnetism

It’s funny how your memory can deceive you. I thought my interest in writing homework problems began with my work on Intermediate Physics for Medicine and Biology. Recently, however, I was rummaging through some old papers and discovered that I’ve been writing homework problems for a lot longer. This habit traces back to my graduate school days at Vanderbilt University, when I worked for John Wikswo. Among my old documents, I found a brittle yellowed copy of “The Magnetic Field of a Single Axon: Practice Problems.” It begins
These problems are presented to help someone to become familiar with the analytic volume conduction models of electric potentials and magnetic fields produced by nerve axons or bundles of nerve or muscle fibers developed between 1982 and 1988 in the Living State Physics Group. The problems vary in difficulty, with the very difficult ones marked by a *.
The problems are drawn from eight publications I helped write back in the day. If you need copies of these articles so you can solve the problems, just email me: roth@oakland.edu. (Technically the journal owns the copyright, so I won’t link to the pdfs in this blog. 😞)
J. K. Woosley, B. J. Roth, and J. P. Wikswo, Jr. (1985) “The Magnetic Field of a Single Axon: A Volume Conductor Model.” Mathematical Biosciences, Volume 75, Pages 1-36.

B. J. Roth and J. P. Wikswo, Jr. (1985)  “The Magnetic Field of a Single Axon: A Comparison of Theory and Experiment.” Biophysical Journal, Volume 48, Pages 93-109.

B. J. Roth and J. P. Wikswo, Jr. (1985) “The Electrical Potential and Magnetic Field of an Axon in a Nerve Bundle.” Mathematical Biosciences, Volume 76, Pages 37-57.

B. J. Roth and J. P. Wikswo, Jr. (1986) “A Bidomain Model for the Extracellular Potential and Magnetic Field of Cardiac Tissue.” IEEE Transactions on Biomedical Engineering, Volume 33, Pages 467-469.

B. J. Roth and J. P. Wikswo, Jr. (1986) “Electrically Silent Magnetic Fields.” Biophysical Journal, Volume 50, Pages 739-745.

B. J. Roth and F. L. H. Gielen (1987) “A Comparison of Two Models for Calculating the Electrical Potential in Skeletal Muscle.” Annals of Biomedical Engineering, Volume 15, Pages 591-602.

J. P. Wikswo, Jr. and B. J. Roth (1988) “Magnetic Determination of the Spatial Extent of a Single Cortical Current Source: A Theoretical Analysis.” Electroencephalography and Clinical Neurophysiology, Volume 69, Pages 266-276.

B. J. Roth (1987) “Longitudinal Resistance in Strands of Cardiac Muscle.” Ph.D. Thesis, Vanderbilt University, Nashville, Tennessee.
Many of these problems require analyzing Bessel functions and Fourier transforms; I was enamored by those mathematical methods in the 80’s. You can get a hint of what these old homework problems are like by looking at Problem 16 in Chapter 8 of IPMB, where the reader must use these techniques to calculate the magnetic field of a nerve axon.

Let me give you another example. Problem 10 in this ancient collection is based on the  paper by Woosley et al.:
Prove that Eq. (36) and (45) are equal.
Equation (36) is the magnetic field of a nerve axon derived using the law of Biot and Savart, and Equation (45) is the magnetic field derived using Ampere’s law. I’ve discussed before in this blog how I could not prove these two equations were equivalent until I found a Wronskian relating Bessel functions.

I’ve also analyzed the IEEE TBME paper in a blog post from 2018.

These practice problems are not for the faint of heart. Nevertheless, most of what you need to solve them is in IPMB. If you want to learn some advanced methods in theoretical bioelectricity and biomagnetism, download the practice problems and give them a try. If nothing else, they will provide insight into what I used to work on as a graduate student. Besides, with the coronavirus pandemic holding you in quarantine, what else do you have to do?

Friday, March 20, 2020

Traveling Waves and Standing Waves

Section 13.2 of Intermediate Physics for Medicine and Biology discusses waves. Russ Hobbie and I note that two solutions to the wave equation exist: traveling waves and standing waves.

Traveling Waves

We write that the pressure distribution p(x,t) = f(xct), where f is any function,
obeys the wave equation... It is called a traveling wave. A point on f(xct), for instance its maximum value, corresponds to a particular value of the argument xct. To travel with the maximum value of f(xct), as t increases, x must also increase in such a way as to keep xct constant. This means that the pressure distribution propagates to the right with speed c... Solutions p(x,t) = g(x + ct), where g is any function, also are solutions to the wave equation, corresponding to a wave propagating to the left.

Standing Waves

We then discuss standing waves.
Standing waves such as p(x,t) = p cos(ωt) sin(kx) are also solutions to the wave equation… [This] standing wave… has nodes fixed in space where sin(kx) is zero… A standing wave can also be written as the sum of two sinusoidal traveling waves, one to the left and one to the right. Conversely, two standing waves can be combined to give a traveling wave.

Converting Traveling Waves to Standing Waves

IPMB includes a homework problem asking the reader to show analytically that two traveling waves combine to make a standing wave, and vice versa.
Problem 8. Use the trigonometric identity sin(a ± b) = sin a cos b ± cos a sin b to show that a traveling wave can be written as the sum of two out-of phase standing waves, and that a standing wave can be written as the sum of two oppositely-propagating traveling waves.

Visualizations

Russ and I also include figures illustrating the difference between a traveling wave (our Fig. 13.4) and a standing wave (Fig. 13.5). To gain insight, however, nothing can replace a dynamic visualization. Fortunately, the internet is full of such visualizations. One appears in the Wikipedia article about standing waves. The Physics Hypertextbook also has traveling and standing wave animations.

This Youtube video shows trigonometry in action: the sum of two oppositely going traveling waves (blue wave propagating right, and green left) add to form a single standing wave (red).

Two traveling waves adding to form a standing wave.

I like the next video because it shows a traveling wave turning into a standing wave when it reflects off a boundary.

A traveling wave turning into a standing wave when it reflects off a boundary.

Here’s a nice video showing how standing waves can be created experimentally.


Standing waves created experimentally on a string fastened at both ends.

Finally, here’s a Flipping Physics video comparing standing and traveling waves. It’s a little corny, but I like it that way.

A lecture about waves from Flipping Physics.

Enjoy!

Thursday, March 19, 2020

Physics Girl

Because of the coronavirus, I had to transform my introductory physics course from in-person to online (in two days!). I thought: If I’m going to teach remotely, I might as well use some of the excellent resources that are available on the internet. This led me to Physics Girl.

Dianna Cowern produces funny and informative videos about physics. Some even deal with medical and biological physics. Below I have embedded a few about biomechanics, sound perception, sun screen, color vision, magnetic resonant imaging, and bioelectricity.

If you’re studying from Intermediate Physics for Medicine and Biology, consider these videos as supplementary material. If you like them, plenty more are at the Physics Girl YouTube channel.

Happy Physicsing!

Testing what exercise actually does to your butt.

What stretching actually does to your body.

Can you guess this note? Perfect pitch and physics.

Sunscreen in the UV.

Does this look like white to you?

The projector illusion.

Wednesday, March 18, 2020

Videos for PHY 3250, Biological Physics

Last fall, I recorded my lectures for my PHY 3250 (Biological Physics) class, and posted them on YouTube. The videos are not great; they are nowhere near professional quality, and often the chalkboard is difficult to read. I originally recorded them as a backup for my students, in case they missed a class or wanted to review something they heard me say in a lecture. Nevertheless, I think that students and instructors may find these videos useful.

My Biological Physics class covers the first ten chapters in Intermediate Physics for Medicine and Biology. Topics include biomechanics, fluid dynamics, the exponential function, biothermodynamics, diffusion, osmotic pressure, bioelectricity, biomagnetism, and feedback.

Some videos are missing: Monday, September 30 was Exam 1; Wednesday, October 30 was Exam 2; Wednesday, November 27 the class played Trivial Pursuit IPMB; and Friday, November 29 was the day after Thanksgiving.

If you are sitting at home self-quarantining with nothing to do, feel free to binge.

Enjoy!

Wednesday, September 4, 2019. Introduction.

Friday, September 6, 2019. Biomechanics.
Monday, September 9, 2019. Hydrostatics.

Wednesday, September 11, 2019. Fluid Dynamics.

Friday, September 13, 2019.  The exponential function.

Monday, September 16, 2019. Scaling.

Wednesday, September 18, 2019. Boltzmann factor.

Friday, September 20, 2019. Heat capacity.

Monday, September 23, 2019. Heat transfer.

Wednesday, September 25, 2019. Review for Exam 1.
Friday, September 27, 2019. Review for Exam 1 (cont.).

Wednesday, October 2, 2019. Heat conduction.

Friday, October 4, 2019. Diffusion.

Monday, October 7, 2019. Diffusion and convection.

Wednesday, October 9, 2019. Osmotic pressure.

Friday, October 11, 2019. Countercurrent exchange.

Monday, October 14, 2019. Bioelectricity.

Wednesday, October 16, 2019. Hodgkin & Huxley model.

Friday, October 18, 2019. Hodgkin & Huxley model (cont.).

Monday, October 21, 2019. The cable equation.

Wednesday, October 23, 2019. Action potential propagation.

Friday, October 25, 2019. Review for Exam 2.

Monday, October 28, 2019. Review for Exam 2 (cont.).

Friday, November 1, 2019. Extracellular stimulation of nerves.

Monday, November 4, 2019. Extracellular potentials and the dipole.

Wednesday, November 6, 2019. The heart.

Friday, November 8, 2019. The electrocardiogram.

Monday, November 11, 2019. Pacemakers and defibrillators.

Wednesday, November 13, 2019. The electroencephalogram.

Friday, November 15, 2019. Biomagnetism.

Monday, November 18, 2019. Transcranial magnetic stimulation.

Wednesday, November 20, 2019. Cardiac restitution.

Friday, November 22, 2019. Cellular automata.

Monday, November 25, 2019. Feedback.


Monday, December 2, 2019. Feedback (cont.).
Monday, December 4, 2019. Review for Exam 3.

 Wednesday, December 6, 2019. Review for Exam 3 (cont.).

Tuesday, March 17, 2020

The Ophthalmoscope

The First Steps in Seeing, by Robert Rodieck, superimposed on Intermediate Physics for Medicine and Biology.
The First Steps in Seeing,
by Robert Rodieck.
In The First Steps in Seeing, Robert Rodieck describes the ophthalmoscope.
Light passes into the eye through the pupil, and continues through its mainly transparent interior to reach the retina. The portion of the light that is not caught by the photoreceptors is either absorbed or scattered in all directions by the underlying tissues. Some of the scattered light passes back through the pupil and out of the eye. But when we look into another person’s pupil, the back of the eye, or fundus, appears black. This is because the optical pathway of the light that enters the eye and falls on a given region of the fundus is the same as that of the light scattered from that region, which leaves the eye through the pupil. In effect, in order to see the interior of the eye under ordinary conditions, one has to place one’s head into this common pathway of the light.

A brilliant young clinician, Hermann von Helmholtz (1821-1894), grasped this issue, and realized that all he needed to do to see the interior of another person’s eye was to devise an optical device by which he could get both his head and the light into the pathway. He did so by placing a piece of glass between his eye and the patient’s and angling the glass so that it partially reflected the light from a lamp into the patient’s eye… The piece of glass and the lamp formed a device termed an ophthalmoscope (Greek opthalmos = eye + skopion, from skopein = to see). Modern ophthalmoscopes have a built-in light source, colored filters to emphasize some aspect of the view, and lenses to correct for any error in the optics of the clinician or patient (i.e., lenses of the same power that they might use in spectacles.)
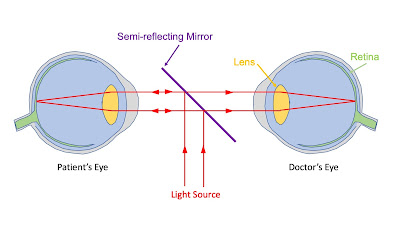
The picture below shows a simple ophthalmoscope, which consists of just a light source, a semi-reflecting mirror, and two eyes.
An ophthalmoscope.
An ophthalmoscope.
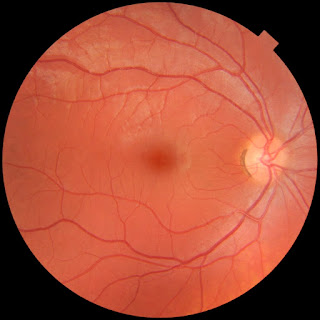
An image of the retina, as might be seen using an ophthalmoscope, is shown below. The dark patch in the center is the fovea, where the cone density is greatest. The light patch to its right is the optic disc where the optic nerve enters the blood vessels converge.

An image of the retina.
From Häggström, Mikael (2014). “Medical Gallery of Mikael Häggström 2014.”
WikiJournal of Medicine 1 (2). DOI:10.15347/wjm/2014.008
Learn more about the ophthalmoscope and its history from a website maintained by the College of Optometrists. Learn more about Helmholtz in one of my previous posts. Learn more about the physics of the eye in Chapter 14 of Intermediate Physics for Medicine and Biology.

The ophthalmoscope is yet one more example of how physics contributes of medicine and biology. 

Monday, March 16, 2020

Visual Acuity

The coronavirus has led to events being canceled, people being isolated, and classes being disrupted. What can I do to help? I plan to post to this blog more often, so students can learn how physics is applied to medicine and biology. I can’t promise daily posts, but I’ll do what I can.

Russ Hobbie and I discuss visual acuity—how sharp your vision is—in Chapter 14 of Intermediate Physics for Medicine and Biology.
The maximum photopic (bright-light) resolution of the eye is limited by four effects: diffraction of the light passing through the circular aperture of the pupil (5–8 μm), spacing of the receptors (≈ 3 μm), chromatic and spherical aberrations (10–20 μm), and noise in eyeball aim (a few micrometers)… The total standard deviation is (62+32+152+52)1/2 = 17 μm in the image on the retina. Since the diameter of the eyeball is about 2 cm, this corresponds to an angular size... of (17 × 10-6)/(2 × 10-2) = 8.5 × 10⁻⁴ rad = 0.048 ° = 2.9 min of arc.
Let’s examine the factors contributing to acuity, one by one.

Diffraction

The Rayleigh criterion specifies the minimum angular separation, θmin, of two objects that can just be resolved. The criterion can be expressed as θmin = 1.22 λ/D, where λ is the wavelength of light and D is the diameter of the pupil. If we use light from the center of the visible spectrum—say green light with wavelength 550 nm—and a pupil diameter of 2.5 mm, we get θmin = 0.00027 radians, which is 0.015° or 0.93 minutes of arc. If we take the eyeball diameter to be 2 cm, that translates into a minimum separation on the retina of 5.4 μm.

The Spacing of Receptors

According to The First Steps in Seeing, by Robert Rodieck, in the fovea cones have a density of about 0.1 per square micron. That translates roughly into a 3 micron separation between cones. The cone density is down by a factor of ten in other parts of the retina.

Chromatic and Spherical Aberration

The First Steps in Seeing, by Robert Rodieck, superimposed on Intermediate Physics for Medicine and Biology.
The First Steps in Seeing,
by Robert Rodieck
Chromatic aberration arises because the index of refraction of the eye, including the lens, depends on wavelength of the light. Therefore, different colors form images at different locations. Spherical aberration arises because a spherical lens is not ideal for forming images; off-axis rays have a different focal point than on-axis rays. The eye and its lens, however, are not truly spherical, so when we speak of spherical aberration in the context of vision, we mean heterogeneities in the imaging system that cause the image to be blurred. Rodieck says
At night the pupil is fully open, and the spread of photons is due mainly to the optical imperfections of the eye; the effects of these imperfections increase rapidly with pupil size. The other factor that contributes to the spread of photons is intrinsic to the nature of how photons go from place to place, and is termed diffraction. This factor is not significant here, but in daylight, when the pupil is small, the spread of photons in the retinal image is due mainly to diffraction.

Noise in Eyeball Aim

Rodieck explains how your gaze is always moving, even when staring at a stationary object.
Gazing at a stationary object also involves smooth eye movements. This is because your head is always in slight motion as the muscle of your body and neck attempt to maintain your posture. Thus when you look as steadily as possible at some small stationary object, such as a pebble on the ground, your slight head movements cause the image of the pebble to move on your retina.
This motion has some noise, which limits our visual acuity.

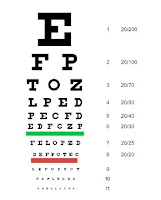
A Snellen chart for testing visual acuity.
A Snellen chart.

A Snellen chart is the traditional way to measure visual acuity. You stand 6 meters (20 feet) from the chart and read the letters with one eye. If you plan to print out this chart, you need to make sure it is the correct size; the topmost “E” should be 87.3 mm tall. In that case, the 20/20 row corresponds to letters that subtend 5 minutes of arc.

The Big Dipper. The second star in the handle is a double.
Another test of visual acuity arises because the second star from the end of the handle of the Big Dipper is actually a double star: Mizar and Alcor. They are separated by 12 minutes of arc. George Bohigian published an article in Survey of Ophthalmology (Volume 53, Pages 536-539, 2008) about “An Ancient Eye Test—Using the Stars.” He begins
A common vision test in ancient Persia used the double star of the Big Dipper in the constellation Ursa Major or the Big Bear. This vision evaluation test was given to elite warriors in the ancient Persian army and was called “the test” or “the riddle.” The desert Arabs, especially the Bedouins, used the separation of Mizar and Alcor as a test of good vision. The separation of these two stars is known as the Arab Eye Test , and has been used in antiquity to test children's eyesight. This article explores the origin, history, and practicality of this eye test and how it correlates with the present-day Snellen visual acuity test.
He concludes
The Arab Eye Test using the double star of Mizar and Alcor remains a practical test of visual acuity and visual function as it was over 1000 years ago. This test is somewhat equivalent to the 20/20 in the Snellen visual acuity nomenclature. This is the first report that correlates the Mizar–Alcor naked eye test with the current Snellen visual acuity test. With the spread of Islam from Spain to Central Asia, the Arabs brought their knowledge of astronomy mixed with the traditions of Greece, India, Babylonia, and Persia to Western civilization.

Throughout our history the stars have been a constant guide to navigation, measure the seasons, to divine the future, and to measure eyesight. The Arab Eye test is an example of how a natural phenomenon has been used for a practical purpose.

Friday, March 13, 2020

Arguing With Zombies

Arguing With Zombies:
Economics, Politics, and the
Fight for a Better Future
,
by Paul Krugman.
Recently I read Arguing With Zombies: Economics, Politics, and the Fight for a Better Future, by Paul Krugman. The book is a collection of editorials and blog posts Krugman wrote for the New York Times, plus a few other previously-published articles. I enjoy Krugman’s writings, but what do they have to do with biological physics or medical physics? Based on the first 390 pages of his book, the answer is: nothing. But near the end was a 1993 article that appeared in The American Economist titled “How I Work” that is relevant to Intermediate Physics for Medicine and Biology. One feature I like best about IPMB is its emphasis on deriving simple “toy models” that provide insight. Simple models aren’t in fashion in biomedical research, but I like them and so does Krugman.

“How I Work” lists Krugman’s four basic rules governing his research. You can read excerpts of his analysis below. Whenever he starts applying his rules specifically to economics, just replace all the financial talk with illustrations from physics applied to medicine and biology.

Listen to the Gentiles

What I mean by this rule is “Pay attention to what intelligent people are saying, even if they do not have your customs or speak you analytical language.”…

I am a strong believer in the importance of models, which are to our minds what spear-throwers were to stone age arms: they greatly extend the power and range of our insight. In particular, I have no sympathy for those people who criticize the unrealistic simplifications of model builders, and imagine that they achieve greater sophistication by avoiding stating their assumptions clearly. The point is to realize that economic models are metaphors, not truth.
For a physicist working in medicine and biology, the “gentiles” would be the biologists and medical doctors. They have much to tell us. For example, when I worked at the National Institutes of Health I learned a lot about magnetic stimulation of nerves from Mark Hallett and Leo Cohen, even if sometimes they mixed up their electricity and magnetism.

I like Krugman’s emphasis on using models to extend our insight. Models may not be as common in pure physics, where you can deduce things from fundamental principles, but biology is so complicated that you can rarely start from Schrödinger's equation and get anywhere. You build models to make sense of biological complexity.

Question the Question

In people in a field have bogged down on questions that seem very hard, it is a good idea to ask whether they are really working on the right questions. Often some other question is not only easier to answer but actually more interesting!
Organisms are so complex that often the right questions aren’t obvious. It’s hard to teach a student how to ask better questions, but we must try.

Dare to be Silly

If you want to publish a paper in economic theory, there is a safe approach: make a conceptually minor but mathematically difficult extension to some familiar model. Because the basic assumptions of the model are already familiar, people will not regard them as strange; because you have done something technically difficult, you will be respected for your demonstration of firepower. Unfortunately, you will not have added much to human knowledge.

What I found myself doing in the new trade theory was pretty much the opposite. I found myself using assumptions that were unfamiliar, and doing very simple things with them. Doing this requires a lot of self-confidence, because initially people (especially referees) are almost certain not simply to criticize your work but to ridicule it….

The age of creative silliness is not past. Virtue, as an economic theorist, does not consist in squeezing the last drop of blood out of assumptions that have come to seem natural because they have been used in a few hundred earlier papers. If a new set of assumptions seems to yield a valuable set of insights, then never mind if they seem strange.
Throughout my career, I have developed simple models. For example, one of my favorite publications is “How to Explain Why Unequal Anisotropy Ratios is Important Using Pictures but No Mathematics.” It consists of some almost silly hand-waving that is amazingly effective at explaining how electric fields interact with cardiac tissue. Another example is my paper “Virtual Electrodes Made Simple” in which I use a trivial little cellular automaton to explain how certain cardiac arrhythmias begin.

Biomedical engineers are doing some incredibly sophisticated calculations to simulate how our bodies work, and these studies are necessary and valuable. But I believe that for those of us who apply physics to medicine and biology, the age of creative silliness expressed through simple models is not yet over. That’s why Russ Hobbie and I stress building models in Intermediate Physics for Medicine and Biology.

Simplify, Simplify

The injunction to dare to be silly is not a license to be undisciplined. In fact, doing really innovative theory requires much more intellectual discipline than working in a well-established literature. What is really hard is to stay on course: since the terrain is unfamiliar, it is all too easy to find yourself going around in circles…. And it is also crucial to express your ideas in a way that other people, who have not spent the last few years wrestling with your problems and are not eager to spend the next few years wrestling with your answers, can understand without too much effort.

Fortunately, there is a strategy that does double duty: it both helps you keep control of your own insights, and makes those insights accessible to others. The strategy is: always try to express your ideas in the simplest possible model. The act of stripping down to this minimalist model will force you to get to the essence of what you are trying to say….

The downside of this strategy is, of course, that many of your colleagues will tend to assume that an insight that can be expressed in a cute little model must be trivial and obvious—it takes some sophistication to realize that simplicity may be the result of years of hard thinking…. There is a special delight in managing not only to boldly go where no economist has gone before, but to do so in a way that seems after the fact to be almost child’s play.
Physicists working in medicine share some of the frustrations that Krugman experiences. Reviewers of papers—and especially reviewers of grant proposals for the National Institutes of Health—often don’t appreciate simple models. My simulations of cardiac electrophysiology have always lacked the particular ion channel that the referee believed was critical, and my biomechanics models tend to use simplifications such as linear strains that trigger objections. (A referee for one of my National Science Foundation applications claimed “this proposal should never have been submitted.”😮)

I often discard biological realism in order to focus on the one or two new features of a model. I’m not asserting that the discarded behavior is unimportant. Rather, I want a simple model so I can highlight the new feature that I’m studying. I don’t want my message to be frittered away by detail. Like Thoreau, Krugman and I strive to simplify, simplify! I hope students using Intermediate Physics for Medicine and Biology learn to appreciate the value of a simple model.

Read “How I Work” online for free.

Listen to Paul Krugman explain how he revolutionized trade theory.
He and I are both big Asimov fans.

Friday, March 6, 2020

The American Physical Society March Meeting: A Victim of the Coronavirus

I planned to devote this blog post to a discussion of the American Physical Society March Meeting, which was to be held in Denver this week. Unfortunately, the APS cancelled the meeting because of concerns about the coronavirus.
An email from the American Physical Society cancelling the March Meeting because of the coronavirus.
Email from the American Physical Society cancelling the March Meeting.
I learned of the cancellation eight hours before I was to leave for the airport. I’m not angry with the APS; I understand the difficult situation the organizers faced. Frankly, I was worried about contracting the virus at the meeting, and then carrying it back to southeast Michigan. Nevertheless, the last minute cancellation was frustrating.

On the bright side, this blog offers me an opportunity to share what I was going to say at my presentation. The talk was, in fact, closely related to Intermediate Physics for Medicine and Biology. Phil Nelson—author of the trilogy Biological Physics, Physical Models of Living Systems, and From Photon to Neuron—organized a session about “Bringing Together Biology, Medicine, and Physics in Education,” and invited me to speak.
The session “Bringing Together Biology, Medicine, and Physics in Education”
that was supposed to be held at the American Physical Society March Meeting.
Below is my abstract.
The Purpose of Homework Problems is Insight, Not Numbers:
Crafting Exercises for an Intermediate Biological Physics Class

Bradley Roth 
Oakland University 

Richard Hamming famously said “The purpose of computing is insight, not numbers.” This view is true also for homework problems in an intermediate-level physics class. I constantly tell my students “an equation is not something you plug numbers into to get other numbers; it tells a story.” I will use examples from courses in Biological Physics and Medical Physics to illustrate this idea. A well-formed homework problem must balance brevity with storytelling. Often the problem is constructed by creating a “toy model” of an important biological system, and analysis of the toy model reveals some important idea or insight. A collection of such problems becomes a short-course in mathematical modeling as applied to medicine and biology, which is a skill that needs to be cultivated in biology majors, pre-med students, and anyone interested in using physical and mathematical tools to study biology and medicine.
If you want to hear more, download the powerpoint presentation at the book’s website: https://sites.google.com/view/hobbieroth/home.

Russ Hobbie and I are proud of the homework problems in Intermediate Physics for Medicine and Biology. We hope you will gain much insight from them.

***************************************************

The pile of books that I used as props during my online talk, including Intermediate Physics for Medicine and Biology.
The pile of books that I used as props
during my online talk.
That’s how the post ended when I wrote it Sunday evening. Then a miracle happened. Physicists began spontaneously organizing an online version of the APS March Meeting! By Tuesday I was listening to Leon Glass give a wonderful talk about cardiac dynamics. On Wednesday I heard Harry McNamara give a fascinating lecture about stimulating and recording electrical activity using light. On Thursday afternoon all the speakers (including myself) in the “Bringing Together Biology, Medicine, and Physics in Education” session presented our talks remotely. I greatly enjoyed it. Over 35 people listened online; I wonder if we would have had that many in Denver? Because I was sitting in my office, I was able to use many of the textbooks that I mentioned in my powerpoint as props. A video was made of each talk, and I’ll post a link to it in the comments when it’s available.

Phil Nelson is a hero of this story. He led the effort in the APS Division of Biological Physics, exhorting us that
Although we are all reeling from the abrupt cancellation of the March Meeting, it’s time for resilience. Science continues despite big bumps in the road, because science is important and it’s what we do.
 Amen!

Friday, February 28, 2020

Magnetoencephalography: Theory, Instrumentation, and Applications to Noninvasive Studies of the Working Human Brain

Screenshot of the title and abstract of Hämäläinen, Hari, Ilmoniemi, Knuutila, and Lounasmaa, "Magnetoencephalography: Theory, Instrumentation, and Applications to Noninvasive Studies of the Working Human Brain. Rev. Mod. Phys. 65:413-497, 1993.
Hämäläinen et al. (1993).
In Chapter 8 of Intermediate Physics for Medicine and Biology, Russ Hobbie and I cite one of my favorite review papers: “Magnetoencephalography: Theory, Instrumentation, and Applications to Noninvasive Studies of the Working Human Brain,” by Matti Hämäläinen, Rita Hari, Risto Ilmoniemi, Jukka Knuutila and Olli Lounasmaa (Reviews of Modern Physics, Volume 65, Pages 413-497, 1993). The authors worked in the Low Temperature Laboratory at Helsinki University of Technology in Espoo, Finland. Even though this review is over 25 years old, it remains an excellent introduction to recording biomagnetic fields of the brain. According to Google Scholar, this classic 84-page reference has been cited over 4500 times. Below is the abstract.
Magnetoencephalography (MEG) is a noninvasive technique for investigating neuronal activity in the living human brain. The time resolution of the method is better than 1 ms and the spatial discrimination is, under favorable circumstances, 2—3 mm for sources in the cerebral cortex. In MEG studies, the weak 10 fT—1 pT magnetic fields produced by electric currents flowing in neurons are measured with multichannel SQUID (superconducting quantum interference device) gradiometers. The sites in the cerebral cortex that are activated by a stimulus can be found from the detected magnetic-field distribution, provided that appropriate assumptions about the source render the solution of the inverse problem unique. Many interesting properties of the working human brain can be studied, including spontaneous activity and signal processing following external stimuli. For clinical purposes, determination of the locations of epileptic foci is of interest. The authors begin with a general introduction and a short discussion of the neural basis of MEG. The mathematical theory of the method is then explained in detail, followed by a thorough description of MEG instrumentation, data analysis, and practical construction of multi-SQUID devices. Finally, several MEG experiments performed in the authors laboratory are described, covering studies of evoked responses and of spontaneous activity in both healthy and diseased brains. Many MEG studies by other groups are discussed briefly as well.
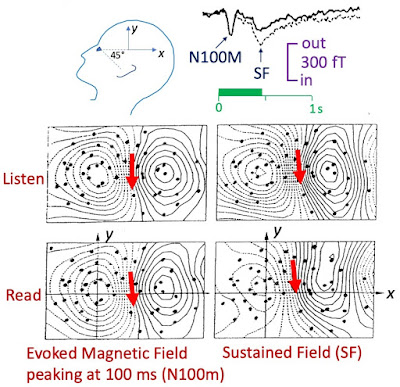
Russ and I mention this review several times in IPMB. When we want to show typical MEG data, we reproduce their Figure 47, showing the auditory magnetic response evoked by listening to words (our Fig. 8.20). Below is a version of the figure with some color added.

Reproduction of Fig 47 from Hämäläinen et al. (1993), showing an auditory evoked magnetic field from the brain.
Effect of attention on responses evoked by auditorily presented words.
The subject was either ignoring the stimuli by reading (solid trace)
or listening to the sounds during a word categorization task (dotted trace);
the mean duration of the words is given by the bar on the time axis.
The field maps are shown during the N100m deflection and the sustained
field for both conditions. The contours are separated by 20 fT and the dots
illustrate the measurement locations. The origin of the coordinate system,
shown on the schematic head, is 7 cm backwards from the eye corner,
and the x axis forms a 45 angle with the line connecting the ear to the eye.
Adapted from Hämäläinen et al. (1993).
We also refer to the article when discussing SQUID gradiometers, which they discuss in detail. Russ and I have a figure in IPMB showing two types of gradiometers; here I show a color version of this figure adapted from Hämäläinen et al.
Red: a magnetometer. Green: a planer gradiometer.  Blue: an axial gradiometer. Purple: a second-order gradiometer.  Adapted from Hämäläinen et al. (1993).
Red: a magnetometer. Green: a planer gradiometer.
Blue: an axial gradiometer. Purple: a second-order gradiometer.
Adapted from Hämäläinen et al. (1993).
In Chapter 11 of IPMB, Russ and I reproduce my favorite figure from Hämäläinen et al.: their Fig. 8, showing the spectrum of several magnetic noise sources. Earlier in our book, Russ and I warn readers to beware of log-log plots in which the distance spanned by a decade is not the same on the vertical and horizontal axes. Below I redraw Hämäläinen et al.’s figure with the same scaling for each axis. The advantage of this version is that you can easily estimate the power law relating noise to frequency from the slope of the curve. The disadvantage is that you get a tall, skinny illustration.

A reproduction of Fig. 1 from Hämäläinen et al. (1993), showing peak amplitudes and spectral densities of fields due to typical biomagnetic and noise sources.
Peak amplitudes (arrows) and spectral densities of
fields due to typical biomagnetic and noise sources.
Adapted from Hämäläinen et al. (1993).
I like many things about Hämäläinen et al.’s the review. They present some lovely pictures of neurons drawn by Ramon Cajal. There’s a detailed discussion of the magnetic inverse problem, and a long analysis of evoked magnetic fields. In IPMB, Russ and I mention using a magnetically shielded room to reduce the noise in MEG data, but don’t give details. Hämäläinen et al. describe their shielded room:
The room is a cube of 2.4-m inner dimensions with three layers of μ-metal, which are effective for shielding at low frequencies of the external magnetic noise spectrum (particularly important for biomagnetic measurements), and three layers of aluminum, which attenuate very well the high-frequency band. The shielding factor is 103—104 for low-frequency magnetic fields and about 105 for fields of 10 Hz and above.
They show a nice photo of a subject having her MEG measured in this room; I hope she’s not claustrophobic.

The authors were members of a leading biomagnetism group in the 1990s. Matti Hämäläinen is now with the Athinoula A. Martinos Center for Biomedical Imaging at Massachusetts General Hospital and is a professor at Harvard. Rita Hari is an emeritus professor at Aalto University (formerly the Helsinki University of Technology). Risto Ilmoniemi is now head of the Department of Neuroscience and Biomedical Engineering at Aalto. Olli Lounasmaa (1930—2002), the leader of this impressive group, was known for his research in low temperature physics. In 2012 the Low Temperature Laboratory at Aalto was renamed the O. V. Lounasmaa Laboratory in his honor.

What do I like best about the Finn’s landmark review? They cite me! In particular, the experiment I performed as a graduate student working with John Wikswo to measure the magnetic field of a single axon.
Wikswo et al. (1980) reported the first measurements of the magnetic field of a peripheral nerve. They used the sciatic nerve in the hip of a frog; the fiber was threaded through a toroid in a saline bath. When action potentials were triggered in the nerve, a biphasic magnetic signal of about 1 ms duration was detected. Later, the magnetic field of an action potential propagating in a single giant crayfish axon was recorded as well (Roth and Wikswo, 1985). The measured transmembrane potential closely resembled that calculated from the observed magnetic field. From these two sets of data, it was possible to determine the intracellular conductivity.
The videos below, presented by several of the authors, augment the discussion of biomagnetism in Intermediate Physics for Medicine and Biology, and provide a short course in magnetoencephalography. Enjoy!

Matti Hämäläinen: MEG and EEG Signals and Their Sources, 2014.


Rita Hari: How Does a Neuroscientist View Signals and Noise in MEG Recordings, 2015.

Interview with Risto Ilmoniemi, Helsinki, 2015.

Friday, February 21, 2020

Replacement of the Axoplasm of Giant Nerve Fibres with Artificial Solutions

When discussing the electrophysiology of nerve and muscle fibers in Section 6.1 of Intermediate Physics for Medicine and Biology, Russ Hobbie and I write
The axoplasm has been squeezed out of squid giant axons and replaced by an electrolyte solution without altering appreciably the propagation of the impulses—for a while, until the ion concentrations change significantly.
Really? The axoplasm can be squeezed out of an axon like toothpaste? Who does that?

Screenshot of the start of Baker et al. "Replacement of the Axoplasm of Giant Nerve Fibres with Artificial Solutions," J. Physiol., 164:330-354, 1962.
Baker et al. (1962).
The technique is described in an article by Baker, Hodgkin and Shaw (“Replacement of the Axoplasm of Giant Nerve Fibres with Artificial Solutions,” Journal of Physiology, Volume 164, Pages 330-354, 1962). The second author is Alan Hodgkin, Nobel Prize winner with Andrew Huxley “for their discoveries concerning the ionic mechanisms involved in excitation… of the nerve cell membrane.”

Below is my color version of Baker et al.’s Figure 1.
Internal perfusion of an axon.  Adapted from Figure 1D of Baker, Hodgkin and Shaw  J. Physiol., 164:330-354, 1962.
Internal perfusion of an axon.
Adapted from Figure 1D of Baker, Hodgkin and Shaw,
J. Physiol., 164:330-354, 1962.
Their methods section (with my color coding in brackets) states
A cannula [red] filled with perfusion fluid [baby blue] was tied [green] into the distal end of a giant axon [black] of length 6-8 cm. The axon was placed on a rubber pad [dark blue] and axoplasm [yellow] was extruded by passing a rubber-covered roller [purple] over it in a series of sweeps…
I like how a little mound of axoplasm piles up at the end of the fiber (yellow, right). They continue
After an axon had been extruded and perfused it was tied at the lower end, filled with perfusion fluid and impaled with an internal electrode by almost exactly the same method as that used with an intact axon…

One might suppose that this would be disastrous and axons were occasionally damaged by the internal electrode. However, in many instances we recorded action potentials of 100-110 mV for several hours.
This experiment is a tour de force. I can think of no better way to demonstrate that the action potential is a property of the nerve membrane, not the axoplasm.

You may already know Hodgkin, but who is Baker?

Hodgkin was coauthor of an obituary of Peter Frederick Baker (1939-1987), published in the Biographical Memoirs of Fellows of the Royal Society. After describing Baker’s childhood, Hodgkin wrote that he met the undergraduate Baker
when he had just obtained a first class in biochemistry part II. Partly at the suggestion of Professor F. G. Young, Peter decided that he would like to join Hodgkin’s group in the Physiological Laboratory in Cambridge. He also welcomed the suggestion that he should divide his time between Cambridge and the Laboratory of the Marine Biological Association at Plymouth, where there were many experiments to be done on the giant nerve fibres of the squid.
Hodgkin then describes Baker's experiments on internal perfusion of nerve axons.
Peter started work at Plymouth with Trevor Shaw in September 1960 and almost immediately the pair struck gold by showing that after the protoplasm had been squeezed out of a giant nerve fibre, conduction of impulses could be restored by perfusing the remaining membrane and sheath with an appropriate solution... Later, Baker, Hodgkin and Shaw… spent some time working out the best method of changing internal solutions while recording electrical phenomena with an internal electrode. It turned out that it did not matter much what solution was inside the nerve fibre as long as it contained potassium and little sodium. Provided that this condition is satisfied, a perfused nerve fibre is able to conduct nearly a million impulses without the intervention of any biochemical process. ATP is needed to pump out sodium and reabsorb potassium but not for the actual conduction of impulse.

There were also several unexpected findings of which perhaps the most interesting was that reducing the internal ionic strength caused a dramatic shift in the operating voltage characteristic of the membrane... This effect, which finds a straightforward explanation in terms of the potential gradients generated by charged groups on the inside of the membrane, helped to explain several unexpected results that were sometimes thought to be inconsistent with the ionic theory of nerve conduction.
Baker went on to perform an impressive list of research projects (his obituary cites nearly 200 publications). Unfortunately, he died young. Hodgkin concludes
Peter Baker’s sudden death from a heart attack at the early age of 47 has deprived British science of one of its most gifted and versatile biologists. He was at the height of his scientific powers and had many ideas for new lines of research, particularly in the borderland between molecular biology and physiology.
Both Baker and Hodgkin appear in this video. They are demonstrating voltage clamping, not internal perfusion.

Watch Alan Hodgkin and Peter Baker demonstrate voltage clamping.