In Chapter 5 of the 4th edition of
Intermediate Physics for Medicine and Biology,
Russ Hobbie and I discuss the
artificial kidney as an example of the use of physics and engineering to solve a medical problem. Rather than delving into the engineering details, today we consider the larger question of technology in medicine. Russ and I write
The reader should also be aware that this “high-technology” solution to the problem of chronic renal disease is not an entirely satisfactory one…
The distinction between
a high-technology treatment and a real conquest of a disease
has been underscored by Thomas (1974, pp. 31–36).
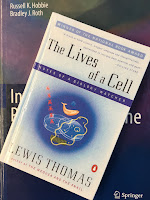 |
The Lives of a Cell,
by Lewis Thomas. |
The citation is to the book
The Lives of a Cell by
Lewis Thomas (physician, poet, essayist, administrator). To me, his essays—written 40 years ago—sound surprisingly modern. For instance, the introduction to his essay about “The Technology of Medicine” is relevant today as we struggle with the role of expensive technology in the ever-increasing cost of health care.
Technology assessment has become a routine exercise for the scientific enterprises on which the country is obliged to spend
vast sums for its needs. Brainy committees are continually evaluating the effectiveness and cost of doing various things in
space, defense, energy, transportation, and the like, to give advice about prudent investments for the future.
Somehow medicine, for all the $80-odd billion that it is said to cost the nation [$2-something trillion in 2013], has not yet come in for much of this analytical
treatment. It seems taken for granted that the technology of medicine simply exists, take it or leave it, and the only major
technologic problem which policy-makers are interested in is how to deliver today's kind of health care, with equity, to all the
people.
When, as is bound to happen sooner or later, the analysts get around to the technology of medicine itself, they will have to
face the problem of measuring the relative cost and effectiveness of all the things that are done in the management of disease.
They make their living at this kind of thing, and I wish them well, but I imagine they will have a bewildering time…
The analysts have finally gotten around to it. As our nation spends 15% of our
Gross Domestic Product on health care, the costs of technology in medicine are no longer taken for granted. The
Affordable Care Act (a.k.a. Obamacare) focuses on research into the
comparative effectiveness of treatments, often measured by the
incremental cost-effectiveness ratio. And as Thomas predicted, the analysts are having a bewildering time dealing with it.
Thomas divides “technology” into three types. His first type is not really technology at all (“no-technology”). It is “supportive therapy”, that “tides patients over
through diseases that are not, by and large, understood.” There is not much physics in this category, so we will move on.
The second level of technology, which he calls “halfway technology,” represents “the kinds of things that must
be done after the fact, in efforts to compensate for the incapacitating effects of certain diseases whose course one is unable to
do very much about. It is a technology designed to make up for disease, or to postpone death.” The artificial kidney, as well as
kidney transplants, fall into this category, and “almost everything offered today for the treatment of
heart disease is at this level of technology, with the
transplanted and
artificial hearts as ultimate examples.” There is lots of physics in this category. Yet, Thomas sees it as, at best, an intermediate—and expensive—type of medical solution. “In fact, this level of technology is, by its nature, at the same time highly sophisticated and profoundly primitive. It is the kind of thing that one must continue to do until there is a genuine understanding of the mechanisms involved in disease.”
The third type of technology is based on a complete understanding of the causes of disease. Thomas writes that it “is the kind that is so effective that it seems to attract the least public notice; it has come to be
taken for granted. This is the genuinely decisive technology of modern medicine, exemplified best by modern methods for
immunization against
diphtheria,
pertussis, and the childhood virus diseases, and the contemporary use of
antibiotics and
chemotherapy for bacterial infections.”
Is there physics in this third category? I think so. Biological mechanisms will be based, ultimately, on the constraints of physical laws, and one can’t hope to understand biology without physics (at least, this is what I believe). Perhaps we can say that physics and engineering are essential for the second type of technology, whereas physics and biology are essential for the third type.
Thomas clearly favors the third category. He concludes
The point to be made about this kind [the third type] of technology—the real high technology of medicine—is that it comes as the result of a
genuine understanding of disease mechanisms, and when it becomes available, it is relatively inexpensive, and relatively easy
to deliver.
Offhand, I cannot think of any important human disease for which medicine possesses the outright capacity to prevent or cure
where the cost of the technology is itself a major problem. The price is never as high as the cost of managing the same
diseases during the earlier stages of no-technology or halfway technology…
It is when physicians are bogged down by their incomplete technologies, by the innumerable things they are obliged to do in
medicine when they lack a clear understanding of disease mechanisms, that the deficiencies of the health-care system are
most conspicuous. If I were a policy-maker, interested in saving money for health care over the long haul, I would regard it as
an act of high prudence to give high priority to a lot more basic research in biologic science. This is the only way to get the
full mileage that biology owes to the science of medicine, even though it seems, as used to be said in the days when the
phrase still had some meaning, like asking for the moon.
As we face the looming crisis of
budget sequestration, with its devastating cutbacks in funding for the
National Institutes of Health and the
National Science Foundation, and as the calls for
translational medical research increase, I urge our legislators to heed Thomas’s advice and “give high priority to a lot more
basic research.”